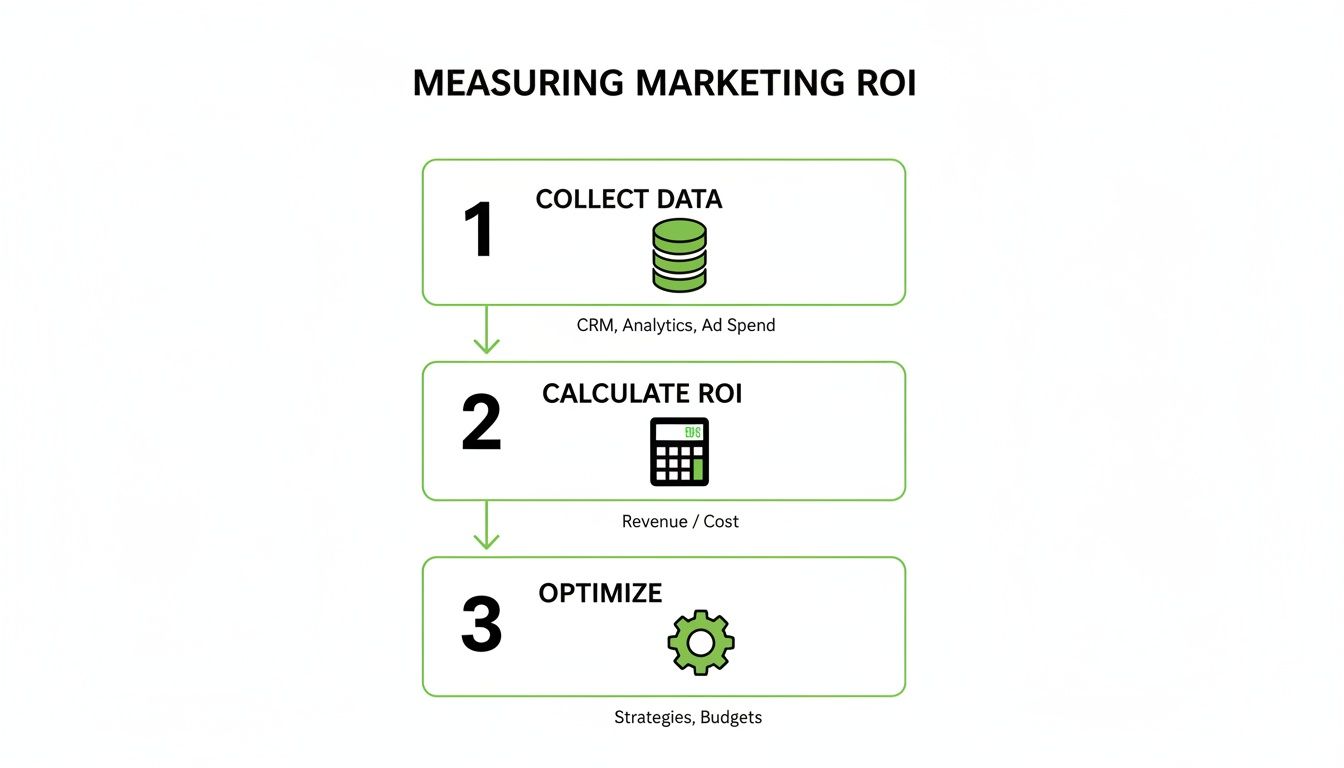
To measure marketing ROI, you calculate the financial return on your marketing efforts by comparing the revenue generated against the total cost. The basic formula is pretty simple: (Revenue - Cost) / Cost
A positive result means you’re making money. But if you think that one number tells you the whole story, you’re missing the point entirely.
Let’s be honest, most ROI talk is just noise
I’m tired of hearing people talk about ROI without understanding what it actually means for the business. So let's cut the crap. Marketing return on investment isn't just a fancy metric for a slide deck; it's the heartbeat of your growth engine. If you can't measure it, you're just setting money on fire.
As an entrepreneur building tech, I've learned that if an investment doesn't have a clear path to return, it's a hobby, not a business strategy. This is brutally true for marketing. We spend thousands—sometimes millions—of euros hoping for a return, but too often, we're flying blind, high on vanity metrics like 'likes' and 'impressions' that do nothing for the bottom line. It’s dumb. We need to stop.
The only thing that matters is how your marketing efforts translate directly to cold, hard cash. This isn't just about justifying your budget to the CFO; it’s about making smart decisions that actually scale the business.
Why everyone is suddenly obsessed with ROI
For years, marketing departments got away with vague reports and fuzzy numbers. That era is over. The pressure to connect marketing activity directly to business results has accelerated dramatically, and proving ROI is now a core job function.
By 2024, 83% of marketing leaders said proving ROI was their top priority, a huge jump from just 68% five years earlier. This 15-point increase shows that measuring your return has become non-negotiable for anyone managing a budget. If you want to dig into the data behind this shift and what it means for agencies, check out the analysis on Textla.
This pressure isn’t just coming from the finance department. It’s coming from a place of necessity. With tighter budgets and more competition than ever, every single euro has to work harder. We can’t afford to guess anymore.
The metrics that actually move the needle
So, where do you start? Forget the endless dashboards with a hundred different metrics. You need to focus on the few that directly connect your activity to revenue. It’s about clarity, not complexity.
Before we get into the nitty-gritty of tracking setups and formulas, let's get our heads straight on what we should even be looking at. Here are the core metrics that should anchor your entire strategy:
- Customer Acquisition Cost (CAC): This is the total cost to get one new paying customer. It includes ad spend, salaries, software—everything. If you don't know this number, you know nothing.
- Customer Lifetime Value (LTV): This is the total revenue you can expect from a single customer over their entire relationship with you. It’s the metric that separates a good business from a great one.
- Return on Ad Spend (ROAS): This is your revenue from a specific ad campaign divided by the cost of that campaign. It's a fantastic short-term pulse check for your paid channels.
Thinking in these terms forces you to move beyond superficial metrics and focus on what truly drives profitable growth. It's the difference between being busy and being effective.
To really hammer this home, let’s organize these ideas into a clear framework. Most marketers get stuck looking at things that feel important but don't actually tell them if they're making money.
Here’s a breakdown of the metrics that actually matter.
Core marketing ROI metrics: what actually matters
| Metric | What It Tells You | Why It Matters for ROI |
|---|---|---|
| Impressions & Clicks | How many people saw your ad and clicked it. The very top of the funnel. | This is your starting point, but it says nothing about ROI. High clicks with no conversions just means you're good at spending money. |
| Conversion Rate (CVR) | The percentage of clicks that result in a desired action (like a form fill or purchase). | A direct indicator of how persuasive your funnel is. Higher CVR means you're turning traffic into tangible outcomes more efficiently. |
| Cost Per Acquisition (CPA/CPL) | The cost to acquire one lead or one conversion action. | This tells you the cost of action, but not necessarily the cost of revenue. It's a critical efficiency metric but still one step away from ROI. |
| Customer Acquisition Cost (CAC) | The total cost to acquire one paying customer. | This is where things get serious. It connects all your marketing and sales costs to a real customer, giving you a baseline for profitability. |
| Customer Lifetime Value (LTV) | The total profit you expect to make from an average customer over time. | The North Star metric. Your marketing is profitable long-term only if LTV is significantly greater than CAC. This justifies upfront spending. |
| Return on Ad Spend (ROAS) | The gross revenue generated for every euro spent on advertising. | The go-to metric for campaign-level profitability. A ROAS of 4:1 means you're making €4 for every €1 you spend. It's tactical and immediate. |
| Return on Investment (ROI) | The total profit generated from the marketing investment, after all costs are accounted for. | This is the ultimate measure of success. It tells the CFO and CEO whether marketing is a growth engine or a cost center. |
See the progression? We move from "are people seeing our stuff?" (Impressions) to "are we actually making money?" (ROI). Too many teams get stuck in the middle, optimizing for cheap leads (CPL) without ever asking if those leads turn into profitable customers.
Don't be one of those teams.
In the next sections, we'll break down exactly how to set up your tracking to measure these accurately, the formulas you’ll actually use, and how to optimize your campaigns for profit, not just leads. Let's get to work. 🚀
Setting up tracking that isn’t garbage
If your data setup is a mess, your ROI calculations will be a complete fantasy. It’s that simple.
Most of the garbage tracking I see comes from a lazy or rushed setup, where people just slap on a standard Google Analytics tag and call it a day. That’s not going to cut it. You have to be methodical about instrumenting your entire funnel, from the first ad click to the final sale.
This is where you get your hands a bit dirty. For our campaigns at dynares, we live inside Google Tag Manager (GTM). It’s the control center for all our tracking scripts, allowing us to manage everything without constantly bugging developers. If you’re not using GTM, you’re making your life unnecessarily hard.
For those new to it, our guide on how to use Google Tag Manager provides a solid starting point for getting it configured correctly.
A well-organized GTM container with clearly named tags, triggers, and variables is the foundation of any reliable system for measuring marketing ROI.
Assigning real value to conversions
Let’s be direct: a lead is a meaningless metric on its own. A lead from a ‘get a demo’ form is infinitely more valuable than one from an ebook download, yet most businesses track them as equal. This is a dumb mistake, and it completely skews your ROI.
You need to assign real, defensible revenue values to your conversion actions.
Even in B2B where the final sale happens months later, you can still do this. Look at your historical data. What’s the close rate for demo requests? If 1 in 10 demo requests turns into a €10,000 deal, then each demo lead is worth €1,000. Do the same for your other lead types.
Here's what that math looks like:
- Demo Request: 10% close rate on a €10,000 average deal = €1,000 lead value.
- Contact Us Form: 5% close rate on a €10,000 average deal = €500 lead value.
- Ebook Download: 0.5% close rate on a €10,000 average deal = €50 lead value.
Assigning these values inside Google Ads transforms its bidding AI. Instead of optimizing for the most leads, it starts optimizing for the most valuable leads. This is how you shift from optimizing for volume to optimizing for revenue.
Don’t skip offline conversion uploads
Here’s the part most people skip, and it’s why their campaigns eventually fail. Your CRM (like HubSpot) knows when a lead becomes a paying customer, but your ad platform doesn’t. If you don't feed that final sales data back to Google, its AI is flying blind.
Offline conversion tracking is the bridge. It connects the dots by telling Google Ads which specific clicks actually resulted in a sale. This process is absolutely critical for long sales cycles.
You’re essentially training the algorithm with your most valuable data: real, closed-won revenue. Skipping this step is like asking a pilot to land a plane with their eyes closed.
To ensure your tracking setup is robust, it's crucial to understand the tools available. You can explore options like gethukt that help with analytics and data integration. These platforms, alongside your core CRM and ad tools, create the ecosystem needed for a full-funnel view.
Getting this right is the difference between guessing and knowing. Don’t shortchange the setup—it’s the most important investment you can make in your marketing intelligence.
The ROI formulas you’ll actually use
Alright, let’s talk formulas. Don't worry, I’m not going to throw a dozen complicated equations at you that you’ll never touch again. The reality is you only need a few, but you need to understand them inside and out.
Forget the noise; focus on what actually drives decisions.
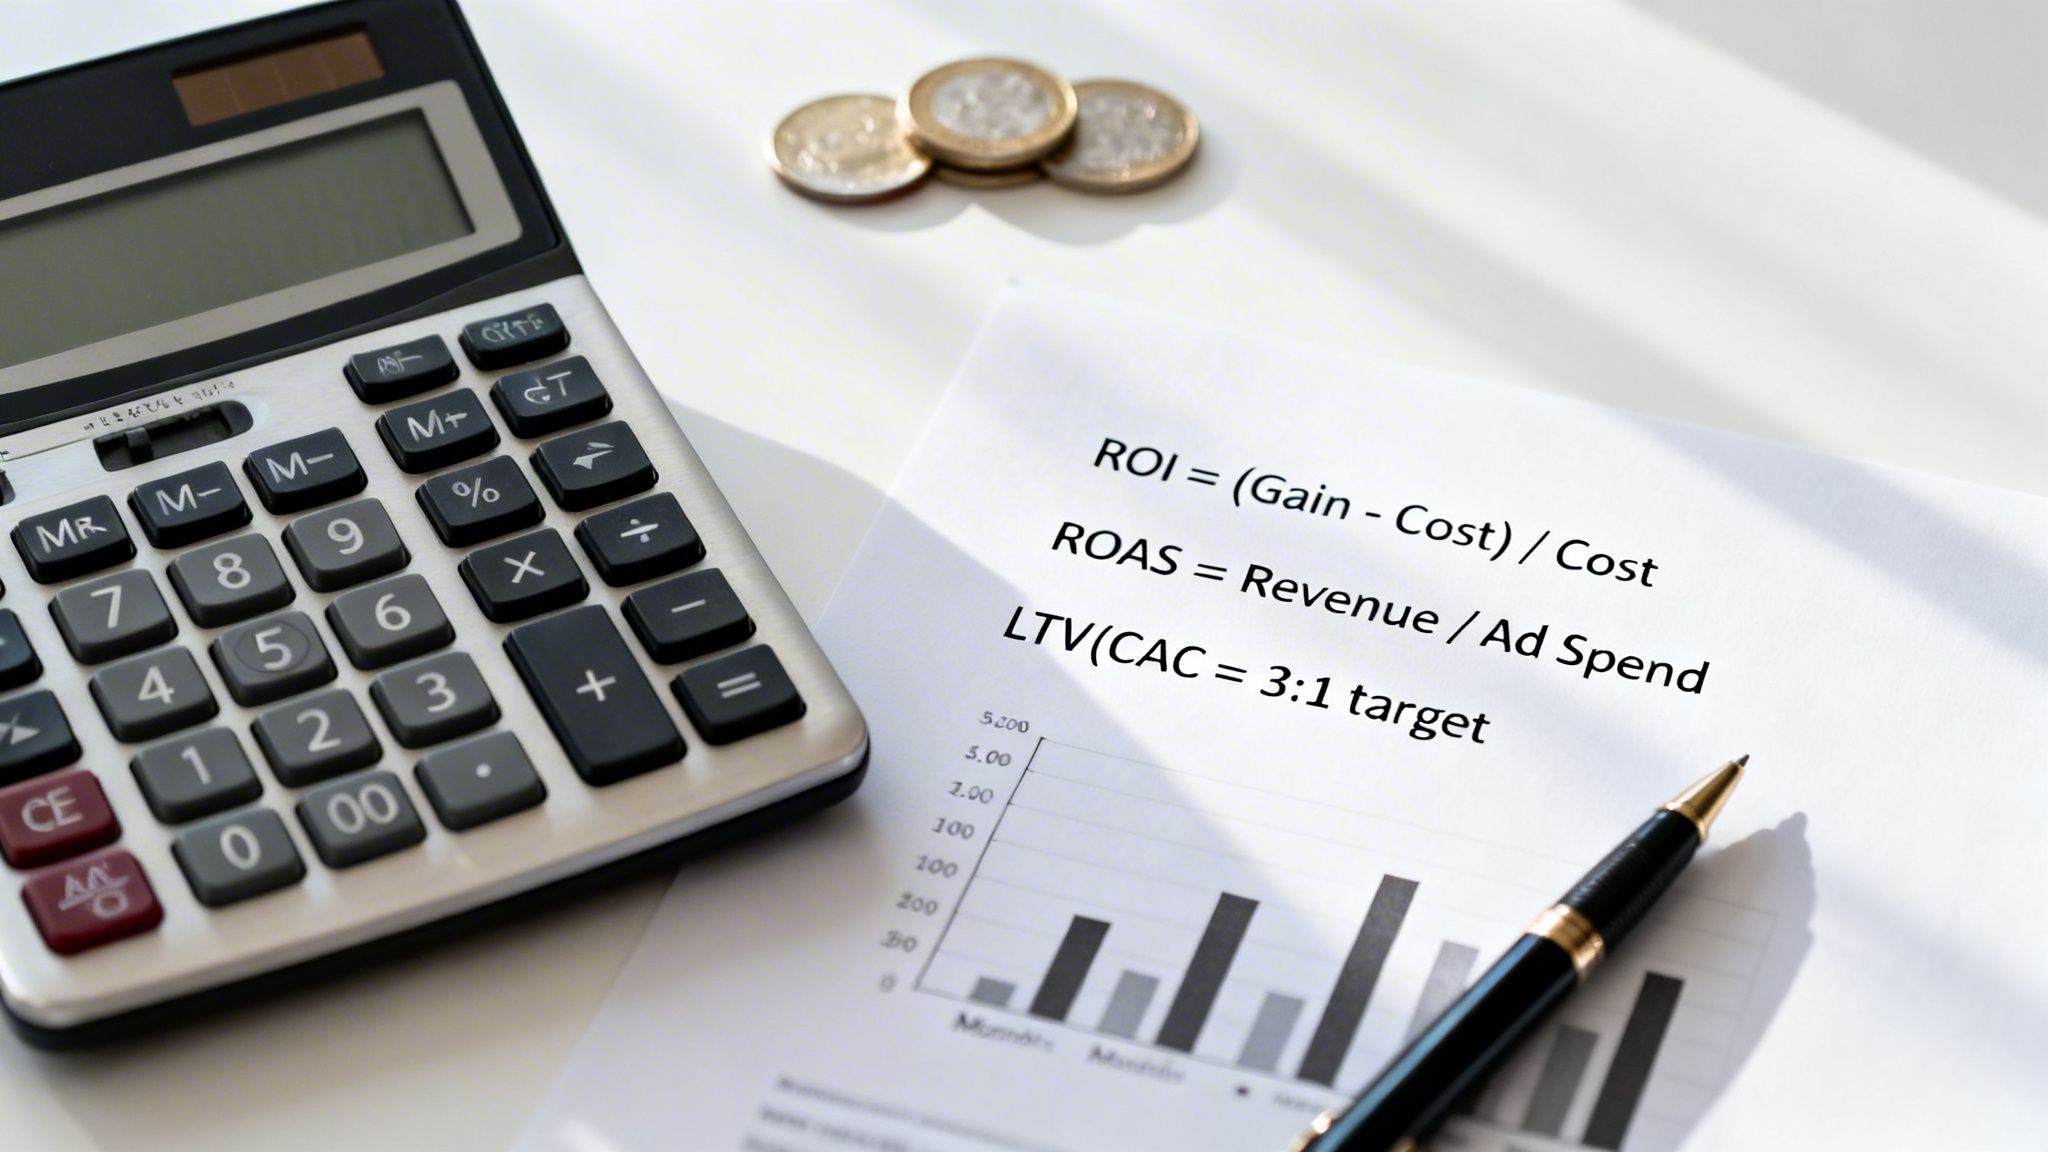
We'll start with the classic. The foundational formula for measuring marketing ROI is deceptively simple: (Revenue Generated - Marketing Cost) / Marketing Cost × 100%.
For example, if you spend €10,000 on a campaign and it brings in €50,000 in sales, your ROI is a neat 400%. This is a great baseline, but as you’ll see, it's just the beginning of the story. For a deeper dive on this and other key metrics, check out this excellent breakdown on LifeSight.io.
This simple formula gives you a quick health check, but it can also be dangerously misleading if you take it at face value.
ROAS: the go-to metric for performance marketers
For those of us deep in the trenches of PPC, Return On Ad Spend (ROAS) is our daily bread. It’s far more granular than the overall ROI and tells you the direct return from your ad campaigns.
The formula is even simpler: Revenue from Ad Campaign / Cost of Ad Campaign.
A ROAS of 4:1 means you’re generating €4 in revenue for every €1 you spend on ads. It's the go-to metric for performance marketers because it gives you a fast, campaign-level pulse check. You can quickly see which campaigns, ad groups, or even keywords are pulling their weight and which are just burning cash.
However, ROAS has a massive blind spot: it completely ignores your profit margins. A 4:1 ROAS sounds amazing, but what if your cost of goods sold (COGS) is 80%?
You spend €100 on ads. You generate €400 in revenue (a 4:1 ROAS). Your product cost is 80% of revenue, which is €320. Your total cost is the ad spend (€100) + the product cost (€320) = €420.
You just lost €20 while celebrating a good ROAS. This is why you can’t stop at ROAS. It’s a tactical metric, not a strategic one. To get a real picture of profitability, you must factor in your gross margin.
The real gold: LTV to CAC
This brings us to the metric that separates scalable businesses from the ones that eventually flame out: the Lifetime Value (LTV) to Customer Acquisition Cost (CAC) ratio. This is the holy grail.
- Customer Acquisition Cost (CAC): The total cost to acquire one new paying customer. Be honest here—include everything: ad spend, salaries, software tools, etc.
- Lifetime Value (LTV): The total profit you predict you’ll make from an average customer over their entire relationship with your business.
The ratio LTV:CAC is what truly matters. A commonly accepted benchmark for a healthy SaaS or subscription business is a ratio of 3:1 or higher. This means for every euro you spend to acquire a customer, you get three euros back in profit over their lifetime.
A 1:1 ratio means you're losing money with every new customer (once you factor in all other business costs). A 3:1 ratio gives you the margin to cover your operational costs and reinvest in growth. Anything over 5:1 is exceptional and means you should be pouring fuel on the fire. 🔥
This ratio completely reframes how you evaluate marketing success. A campaign that appears to be losing money on the first purchase (a low day-one ROI) could actually be your most valuable channel if it’s bringing in customers with a high LTV.
For instance, a content-driven campaign might have a higher CAC than a simple Google search ad. But if those content-driven customers stick around for years and upgrade their plans, their LTV could be double that of the search-acquired customers. Without looking at LTV:CAC, you'd make the dumb move of cutting the more expensive campaign.
This long-term view is what allows you to make ambitious, strategic bets on marketing instead of just chasing short-term wins. It’s the mindset that builds enduring companies. If you're focused on paid ads, we've also written a practical guide on how to calculate ROAS the right way, which dives deeper into these nuances.
Moving beyond last-click attribution
Let's get one thing straight: last-click attribution is the default for a reason. It’s simple. It's also dangerously misleading.
Giving 100% of the credit for a sale to the very last click is like tipping the waiter for a fantastic meal you had after reading three reviews, getting a recommendation from a friend, and checking the menu online. It ignores the entire journey. It’s a lazy way to measure marketing, and it leads to terrible budget decisions.
If you live and die by last-click, you'll inevitably pour all your money into bottom-funnel activities like branded search because they look like they’re doing all the work. Meanwhile, the channels that actually fed those brand searches get their budgets slashed. It's a slow, painful death spiral for growth.
We have to be smarter than that. We have to give credit where it's actually due.
Understanding the main attribution models
To get a real picture of what’s driving your business, you need to look at the entire customer journey, not just the finish line. Different attribution models offer different ways to slice the pie and distribute credit among all the touchpoints. There’s no single perfect model for every business, but almost anything is an improvement over last-click.
Here’s a no-fluff breakdown of the main options:
- First-Click: Gives 100% of the credit to the very first interaction. It’s useful for understanding what’s driving initial awareness, but it’s the mirror image of last-click’s problem—it ignores everything that happened afterward to actually convince someone to buy.
- Linear: This is the 'everyone gets a trophy' model. It splits credit equally across all touchpoints. It’s fairer than first or last-click, but it makes the wild assumption that every single interaction is equally valuable, which is almost never true.
- Time-Decay: This model gives more credit to touchpoints that happened closer to the conversion. It’s a definite step up because it understands that the interactions right before a purchase are often more influential. The downside? It can still undervalue those crucial, early-stage touchpoints that started the whole conversation.
- Data-Driven: This is where we should all be heading. For anyone running Google Ads, this is the goal. Instead of following a rigid, one-size-fits-all rule, it uses machine learning to analyze your unique conversion paths. It then assigns credit based on how much each touchpoint actually contributed to the final conversion.
This isn’t some mythical feature only accessible to giant corporations anymore. If you have enough conversion data, Google's data-driven attribution (DDA) is both powerful and available. It’s the most intelligent way to figure out which combination of ads, keywords, and campaigns truly moves the needle. For a deeper look at how these numbers fit together, check out our guide on mastering key marketing metrics.
Why data-driven is the only real choice
Let’s be candid: your goal should be to switch to data-driven attribution as soon as you possibly can. It’s the only model that learns and adapts to your specific business and customer behavior. It uncovers the hidden heroes in your marketing mix that last-click completely ignores.
A major beverage company discovered this firsthand when they moved to a machine learning-based attribution model. They found their podcast ads were driving 22% more conversions than their old last-click model had ever shown them. You can read more about how they uncovered this massively undervalued channel in these marketing ROI insights.
This is what moving beyond last-click does. It shines a light on hidden gems in your marketing mix, allowing you to invest in what's actually working, not just what's happening at the finish line.
Switching models isn't just a technical exercise; it has direct financial consequences. It empowers you to reallocate your budget with confidence, scaling up the campaigns that introduce new customers and nurture them through the funnel.
The result is a much healthier, more accurate measure of your marketing ROI. Stop being lazy and make the switch. Your bottom line will thank you. 📈
How to optimize for ROI, not just leads
Alright, so you’ve done the hard work. Your tracking is clean, you understand the formulas, and you’ve moved beyond the simplistic trap of last-click attribution. Now for the part that actually matters: using that data to make more money.
Measuring marketing ROI is step one. But a dashboard full of pretty numbers is useless if it doesn’t lead to action. This is where we connect the dots between insight and profit. The goal isn’t just to report on ROI; it's to actively and relentlessly optimize for it.
This is about building a system of continuous improvement fueled by accurate, real-time data. It’s where marketing stops being a cost center and becomes a predictable growth engine.
Train your ad platforms to think in revenue
One of the most powerful—and most overlooked—optimizations is feeding your revenue data back into your ad platforms. When you upload conversion values to a platform like Google Ads, you completely change the game.
You’re giving its Smart Bidding algorithms a new directive. You're telling it: stop finding me the cheapest leads and start finding me the most profitable customers.
This simple action unlocks bidding strategies like Target ROAS (tROAS). Instead of telling Google you’re willing to pay €50 per lead, you tell it you want a 400% return on ad spend. The AI then takes over, prioritizing auctions and users most likely to deliver that specific return.
It’s the difference between flying blind and having an expert co-pilot. You’re no longer just optimizing for volume; you’re optimizing for actual revenue. This is a fundamental strategic shift that separates the pros from the amateurs.
Run tests that actually improve your bottom line
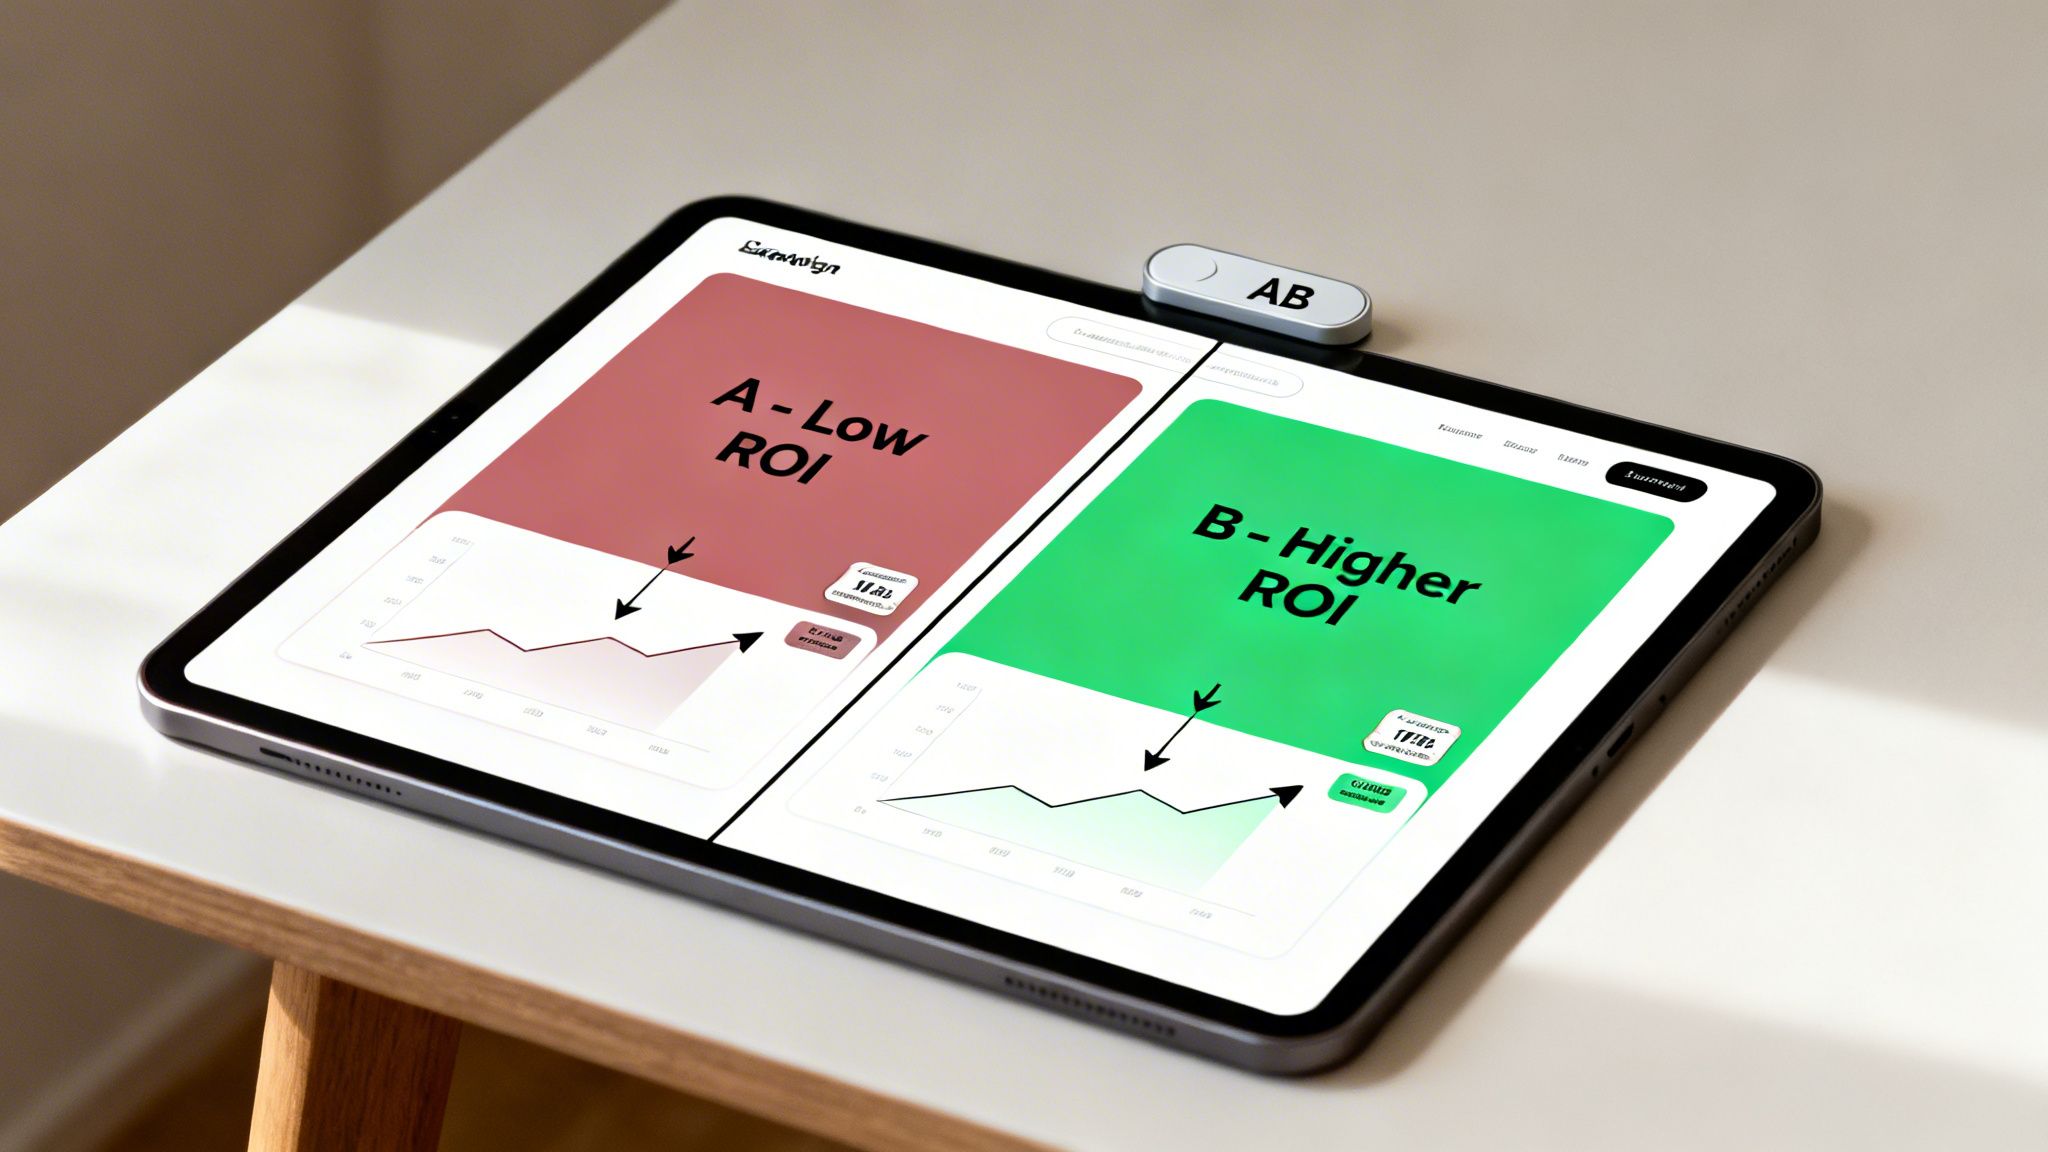
A/B testing isn't just about button colors. True optimization means running relentless tests on the things that have the biggest impact on ROI: your offer, your ad copy, and your landing pages. At dynares, we use our own platform’s auto A/B testing to constantly iterate, but the principle is universal.
You should always have experiments running. Here are a few high-impact tests to start with:
- Offer Testing: Test different value propositions. Does a Free Trial generate higher LTV customers than a Get a Demo offer? Your ROI data will tell you the real story.
- Ad Copy Angles: Pit benefit-driven copy against pain-point-driven copy. See which one attracts users who become high-value customers, not just cheap clicks.
- Landing Page Variations: A great landing page can dramatically increase conversions and, therefore, ROI. A small lift in conversion rate can have a massive downstream effect on profitability. For more on this, check out our guide to building conversion-optimized websites.
The key is to have a structured testing program. Create a hypothesis, run the test until you hit statistical significance, analyze the results against your ROI goals, and implement the winner. Then, start the next test. This is how you build a flywheel of continuous improvement.
Don’t just pause bad keywords or campaigns. Your job isn’t to be an executioner; it's to be a diagnostician. You need to understand why the ROI is low before you kill anything.
Diagnose, don’t just execute
When you see a campaign or keyword with poor ROI, the lazy response is to pause it. The smart response is to ask why. Is it truly a bad keyword, or is there a breakdown somewhere else in the funnel?
Use this simple troubleshooting framework to diagnose underperformers:
- Is it the Ad? Check the Click-Through Rate (CTR). If it’s low, your ad copy or creative probably isn’t resonating with the user's intent. The message is wrong.
- Is it the Landing Page? Look at the Conversion Rate (CVR). If your CTR is high but your CVR is low, you have a landing page problem. The page isn't delivering on the promise of the ad.
- Is it the Offer? If both CTR and CVR look decent, but the resulting leads have a low close rate or small deal size, your offer might be attracting the wrong audience entirely.
By breaking down the problem, you can fix the actual issue instead of just cutting a potentially valuable source of traffic. Maybe a keyword just needs better ad copy or a more relevant landing page to become profitable. This diagnostic approach turns low-ROI segments into opportunities for growth. It’s the mindset that truly lets you optimize your marketing ROI.
Your marketing ROI questions answered
Let's clear up a few common questions that pop up the moment you get serious about ROI. These are the things people wonder about but are sometimes afraid to ask. I'll give you direct, no-nonsense answers based on my experience building and scaling tech products.
There's a lot of noise out there. Let's cut through it.
How do I measure ROI for content marketing or SEO?
This is the classic question. The answer? It’s harder than PPC, but absolutely not impossible. The key is to stop thinking in terms of direct, last-click conversions and start tracking assisted conversions and modeling the customer journey. It requires connecting your data, but it's the only real way to prove the value of long-term efforts.
For SEO, you can attribute a portion of your organic traffic revenue based on which landing pages are bringing in converting users. For content, it's about following the breadcrumbs.
- Track lead origins: Where did leads first enter your world? Was it a blog post, a webinar, or a whitepaper download?
- Follow their journey: Use your CRM to track those specific leads all the way to a closed-won deal.
- Assign value: Calculate a lead value for these top-of-funnel sources based on their historical close rates and average deal sizes.
- Use multi-touch attribution: This is crucial. A model like time-decay or data-driven will show you how that initial blog post influenced a sale, even if a branded search ad got the final click.
Yes, this requires a solid data connection between your website analytics, your ad platforms, and your CRM. But making that effort is what separates a professional marketing operation from one that's just guessing.
What is a 'good' marketing ROI?
Anyone who gives you a single, universal number is trying to sell you something. A good ROI is entirely dependent on your business model, profit margins, and industry. Don't chase someone else's metric.
A common rule of thumb you’ll hear is a 5:1 ratio (500% ROI). For many businesses, this is a strong target, as it generally covers all product and operational costs and leaves a healthy profit. But context is everything.
A SaaS business with high customer lifetime value (LTV) would be thrilled with a 3:1 ratio on the initial acquisition. They know they'll make their money back many times over during the subscription. In contrast, a low-margin e-commerce store might need a 10:1 ratio just to be profitable.
Instead of obsessing over a generic ROI percentage, shift your focus to your LTV:CAC ratio. If that ratio is above 3:1, you're generally in a healthy position to scale. The most important goal is to be consistently improving your own ROI over time, not hitting an arbitrary benchmark.
Focus on your own numbers and your own profitability. That’s what matters.
How long should I wait before measuring the ROI of a new campaign?
Patience is a strategic asset, but you also can’t wait forever. The answer depends entirely on the length of your sales cycle.
For an e-commerce business selling a €50 product, you can get a meaningful read on ROI within a week or two. For a B2B tech company with a 3-month sales cycle, you must wait at least that long to measure true, revenue-based ROI. If you don't, you're measuring incomplete data—which is just as bad as no data at all.
That said, you don't have to fly blind while you wait. Use leading indicators to gauge campaign health in the short term.
During the first 1-4 weeks, monitor these early metrics:
- Cost Per Lead (CPL): Is it within your target range?
- Conversion Rate (CVR): Is your landing page converting clicks into leads effectively?
- Lead Quality (MQLs): Are the leads coming in a good fit, or are they junk?
These indicators will tell you if the campaign is on the right track. But for the final, definitive ROI calculation, you have to be patient enough to let leads mature into actual revenue. Don't make the rookie mistake of pulling the plug on a campaign after two weeks just because it hasn't generated a final sale if your sales process takes two months.
Feeling overwhelmed by the complexity of tracking and optimizing your Google Ads for true ROI? At dynares, we built a platform to solve this exact problem. Our AI automatically generates thousands of high-intent ads and matching landing pages—all with tracking pre-configured—and then optimizes them for revenue using real-time data. Stop guessing and start scaling with dynares.ai.


