Let's be blunt. Your Google Ads metrics and reports are probably a vanity project. They're packed with impressive-looking numbers like clicks and impressions that say almost nothing about actual business growth. They're noise.
As founders, we need signal, not noise. And that means focusing relentlessly on the numbers that connect directly to revenue. It’s that simple.
Your Google Ads dashboard is probably lying to you
I learned this the hard way. Early on, I was obsessed with a high Click-Through Rate (CTR). I’d celebrate a 5% CTR like we’d just closed a Series A, completely blind to the fact my Cost Per Acquisition (CPA) was quietly spiraling out of control.
We were getting tons of clicks, but they were the wrong clicks from the wrong audience.
It was a classic rookie mistake: mistaking activity for progress. My dashboard was telling me a happy story, but my bank account was telling the truth. That experience taught me a crucial lesson—most default dashboards are designed to make you feel good, not make you smart.
Shifting from vanity to sanity
The first step to building useful metrics and reports is to draw a hard line between vanity and sanity. It's a simple but powerful mindset shift that changes everything.
- Vanity metrics are the feel-good numbers: impressions, clicks, even CTR. They're easy to measure and look great in a presentation, but they don't pay the bills. Chasing them is like trying to win a race by running the fastest on a treadmill.
- Sanity metrics are the ones that measure business impact. Think Conversion Rate, Cost Per Acquisition (CPA), and Return On Ad Spend (ROAS). These numbers tell you if your ad spend is actually generating qualified leads and, ultimately, revenue.
To cut through the noise, it's essential to create a reliable data foundation. Implementing a robust strategy like building a single source of truth database is a powerful way to ensure your numbers are trustworthy and consistent across all platforms. This prevents you from making critical decisions based on fragmented or conflicting data.
To put this in perspective, here’s how these metric types stack up against each other.
Vanity vs sanity metrics for PPC
| Metric Category | Vanity Metric (Feels Good) | Sanity Metric (Drives Business) |
|---|---|---|
| Traffic Quality | Impressions, Clicks, CTR | Conversion Rate, Bounce Rate, Time on Page |
| Cost Efficiency | Cost Per Click (CPC) | Cost Per Acquisition (CPA), Cost Per Qualified Lead (CPQL) |
| Business Impact | Total Conversions (without context) | Return on Ad Spend (ROAS), Customer Lifetime Value (LTV) |
| Ad Performance | Ad Position | Quality Score, Conversion Rate by Ad, Cost per Conversion by Ad |
The table makes it clear: one set of numbers makes for a good story, while the other makes for a good business. Our job is to focus on the latter.
The goal isn't to stop tracking top-of-funnel metrics entirely. The goal is to put them in their proper context—as leading indicators for the numbers that truly matter. A great CTR is only great if it leads to a profitable CPA.
This shift requires discipline and the right technical setup. You have to connect the dots from the first click to a closed deal, which means having rock-solid conversion tracking.
If you haven't already, getting comfortable with how to use Google Tag Manager is a non-negotiable first step. It’s the backbone of reliable data collection. This is about building a reporting system that forces accountability, making every euro you spend work for you.
The seven PPC metrics that truly move the needle
Alright, let's cut the crap. Google Ads will happily drown you in data, but when you're running lead generation campaigns, only a handful of PPC metrics actually tell you if you're winning or losing. Everything else is mostly a distraction.
Think of it like flying a plane. The cockpit has dozens of dials, but to get where you're going, you really just need to watch your altitude, speed, and heading. Obsessing over the cabin temperature is a great way to fly into a mountain. The same goes for your metrics and reports.
This map shows the critical difference between vanity metrics that just stroke the ego and sanity metrics that actually grow the business.
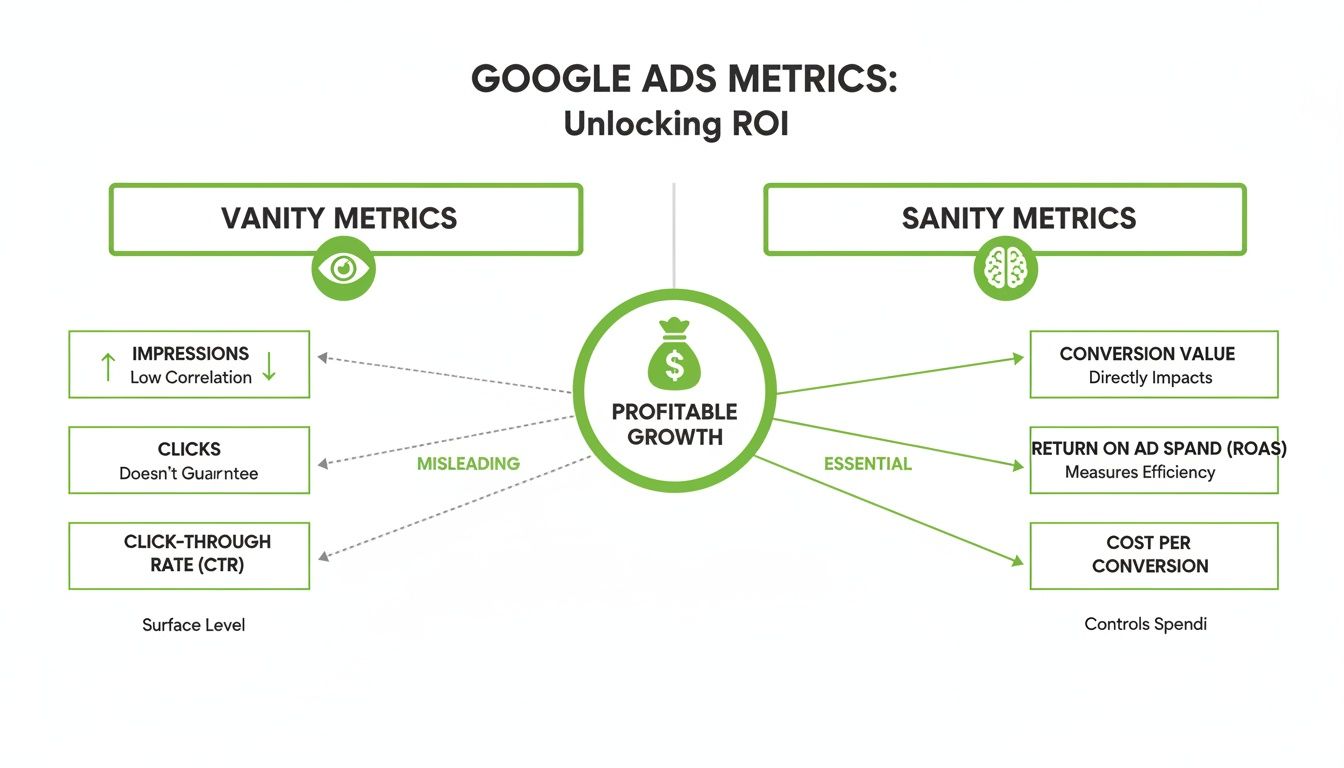
It boils down to this: vanity metrics are about surface-level activity, while sanity metrics are about profitable results. Let’s break down the essential few you need to master.
The core three conversion metrics
If you track nothing else, track these. They are the direct pulse of your paid search efforts. Everything else is secondary.
- Conversion rate: The percentage of clicks that turn into something you actually want—a lead, a demo request, a signup. A high CTR with a low conversion rate is a massive red flag. It means you're attracting the wrong crowd or your landing page is failing to do its one job. It’s the ultimate test of your message-to-market fit.
- Cost per acquisition (CPA): How much cash does it cost to get one new lead? This is your reality check. You could have a world-class conversion rate, but if your CPA is higher than what that lead is worth to you, you're just lighting money on fire.
- Return on ad spend (ROAS): This is the big one. For every euro you put into ads, how many euros do you get back in revenue? ROAS connects your ad budget directly to the bottom line. A 4:1 ROAS (€4 back for every €1 spent) is often seen as a healthy benchmark, but this number is completely dependent on your margins.
Supporting metrics for diagnosis
While the core three tell you what is happening, these next few help you understand why. Think of them as diagnostic tools, not the end goal itself. A good mechanic uses a pressure gauge to find the problem; they don't celebrate the gauge.
- Click-through rate (CTR): A high CTR means your ad is relevant and compelling to your audience. It’s a fantastic leading indicator of ad quality, but it's not the goal. Use it to diagnose weak ad copy or sloppy targeting.
- Cost per click (CPC): Simple enough—this is the price you pay for each click. It’s driven by competition and your Quality Score. Watching your CPC helps you manage your budget, but a low CPC is useless if those cheap clicks never convert. Never sacrifice quality for cheapness.
- Quality score: This is a 1-to-10 score Google gives your ads based on expected CTR, ad relevance, and landing page experience. It directly impacts your CPC and where your ad ranks. A score of 7 or above is where you want to be. Think of it as your secret weapon for long-term efficiency.
Your Quality Score is Google’s opinion of your relevance. A higher score isn't just a vanity number; Google rewards it with a lower Cost Per Click (CPC) and better ad placements. Ignoring it is like willingly paying a higher tax on every single click.
The north star for scaling
Finally, there’s one metric that goes beyond individual campaigns and looks at the entire business picture.
- Lifetime value (LTV): What is a customer worth to your business over their entire relationship with you? Understanding LTV is the key to sustainable scaling. It allows you to confidently pay a higher CPA today because you know you'll make it back (and then some) over the next year or two. This is how you outspend and outmaneuver the competition.
Building a reporting dashboard you will actually use
A report nobody acts on is just a fancy document—a waste of time and pixels. So let's get practical and build a dashboard that actually drives decisions, not just fills up inboxes. Forget complex, multi-tabbed monstrosities. The goal here is brutal clarity.
Whether you're using a spreadsheet, Google Data Studio, or some high-end BI tool, the principle is the same: show the trend, not just the number. A static metric is a snapshot; a trend tells the story of where you're headed. I've seen way too many founders get lost in data points instead of focusing on the directional arrow.
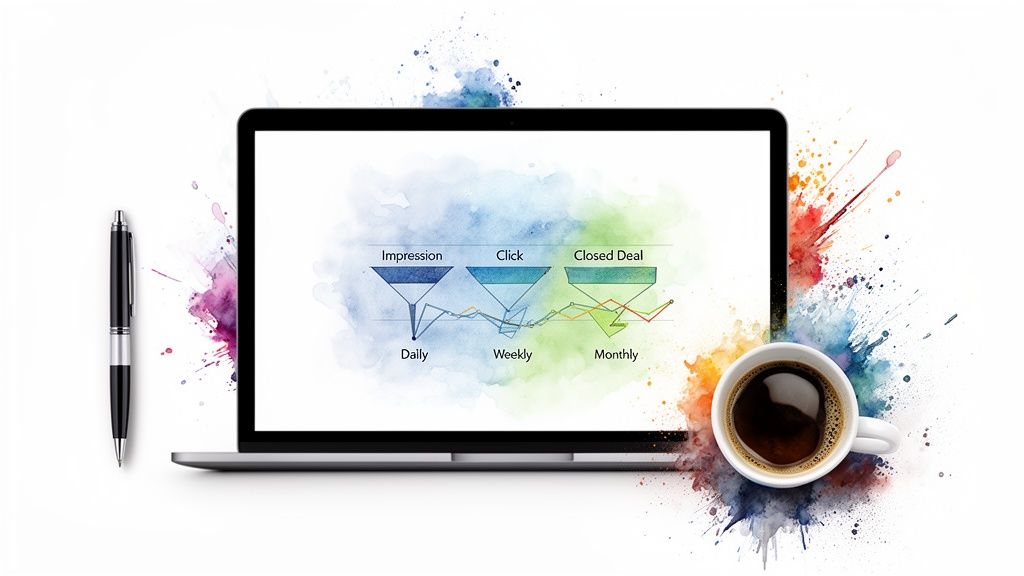
Your dashboard should be a visual map of your entire sales funnel. It needs to tell a cohesive story, from the very first impression right down to a closed deal. This single view immediately shines a light on where the leaks are in your process.
Design for action, not just observation
The best metrics and reports are ruthlessly focused. To achieve that focus, you need to know what kind of report you’re even building. It’s important to understand the difference between operational versus analytical reporting to make sure your dashboard serves its true purpose. One is for day-to-day tweaks, the other is for bigger strategic pivots.
Here’s a simple structure that works for most tech businesses:
- Top section (the helicopter view): Put your three core sanity metrics front and center: CPA, Conversion rate, and ROAS. Show the current period vs. the last period and the same period last year. This tells you instantly if you're winning, losing, or just treading water.
- Middle section (the funnel view): Visualize the customer journey. How many impressions became clicks? How many clicks became leads? How many of those leads were actually qualified? This is where you spot the bottlenecks.
- Bottom section (the ground view): Break down performance by campaign theme or keyword group. This is where you can quickly identify your winners to scale and your losers to kill. It’s all about making fast, decisive cuts and bets.
Finding your reporting rhythm
The right cadence depends entirely on your company's stage and scale. Don't fall into the trap of creating reports just for the sake of it. Tie them to specific decision-making moments.
A weekly report that sparks one smart decision is infinitely more valuable than a daily report that everyone ignores. Your goal is to build a rhythm of insight and action, not a habit of passive observation.
Think about your cadence this way:
- Daily check-in (5 minutes): A quick glance at spend and lead volume. Is anything on fire? No? Good. Move on with your day.
- Weekly review (30 minutes): Analyze the trends from the past week. What worked? What didn't? This is where you make tactical shifts—adjusting bids, pausing failing ad groups, and reallocating small budgets.
- Monthly deep dive (60 minutes): Review the high-level strategy. Are our campaigns hitting our business goals? How is our performance impacting overall revenue targets? This meeting is for big-picture thinking and major budget allocation.
This structure helps you move from the chaos of raw numbers toward genuine clarity. It gives you a framework for telling a compelling story about your growth to your team or investors.
And if you're looking to graduate from manual tracking, our guide on moving from spreadsheet hell to automated PPC funnels with AI shows a clear path forward.
Connecting your ad spend to actual revenue
Let’s talk about the biggest blind spot in PPC.
Too many businesses run fantastic campaigns, see the leads roll in, and have absolutely no idea which ads are actually making them money. It’s a massive, costly mistake. This is where we close the loop between what you do in your ad account and the money that ends up in your bank.
It’s not enough to get a form submission. You need to know if that lead was a tyre-kicker, a serious prospect, or a dream customer who just signed a massive deal.
Without that feedback, you're telling Google’s AI to find you more of everyone, not more of your best customers. That’s just dumb. This is precisely why tools that automate conversion value uploads are such a game-changer. They turn your ad platform from a lead generator into a predictable revenue engine.
Teaching Google AI what a good lead looks like
Think of it this way: not all leads are created equal.
A lead requesting a demo for a 200-seat enterprise plan is infinitely more valuable than a student downloading a whitepaper for their research. If you treat both as a "conversion," you're actively misleading your own campaigns.
Assigning dynamic values to different types of leads is how you fix this. It’s how you start speaking Google’s language—the language of money.
- Demo request: This might be worth €150 to your business based on your average deal size and close rate.
- Whitepaper download: This is lower intent, so maybe it’s only worth €5.
- Contact us form: This is somewhere in the middle, perhaps valued at €50.
Once you start uploading these values, Google's Smart Bidding doesn’t just hunt for more conversions; it hunts for the conversions that bring the most value. It stops optimizing for volume and starts optimizing for profit. This requires a solid technical foundation, and our definitive guide on Google Ads conversion tracking setup is the perfect place to start.
Closing the feedback loop is non-negotiable. It's the difference between guessing which keywords drive revenue and knowing which ones do. One is gambling; the other is building a scalable business.
The final piece of the puzzle
This process also relies on a seamless user journey. When your ad copy, landing page, and call-to-action are perfectly aligned, tracking becomes far more accurate. Mismatched messaging confuses users and breaks the data trail, making your metrics and reports less reliable.
The growth in AI adoption reflects this need for clarity. The AI market surged to over $184 billion, with 35% of companies integrating AI for predictive analytics, yet a staggering 95% struggle with unstructured data. This highlights the critical demand for tools that turn raw click data into actionable revenue insights. You can read more about these 2025 business trends and their impact.
By coordinating your entire funnel, you provide clean, structured data that both users and algorithms can understand.
Common reporting pitfalls and how to avoid them
I’ve made just about every mistake you can make with PPC reporting, and most of them cost me money. This isn’t theory—this is the stuff that burns through real budgets. Let's walk through the most common blunders I see people make, so you can sidestep them entirely.
The single biggest, dumbest mistake is averaging data across campaigns that have completely different jobs. Lumping a brand awareness campaign together with a bottom-of-funnel "buy now" campaign is a recipe for terrible decisions. It's like averaging the speed of a race car and a tractor and deciding you own a moderately fast vehicle. The number is mathematically correct and practically useless.
This kind of lazy reporting masks your biggest wins and your most expensive failures, leaving you with a mushy, meaningless average. You'll have no idea what to scale and what to kill.
Misinterpreting data and chasing ghosts
Data without context is just noise, and it’s dangerous noise at that. I once chased an incredibly low Cost Per Lead (CPL), convinced I was a marketing genius. But when we actually looked at who was converting, we found out those "cheap" leads were students downloading a whitepaper, not prospects ready to buy. We spent months optimizing for ghosts.
Here are a few classic blunders I've personally made or seen happen way too often:
- Cutting "High-CPA" winners: I almost killed a campaign because its CPA was 2x higher than the account average. What the dashboard didn't show me was that this specific campaign was bringing in our most valuable enterprise customers. That "high" CPA was actually a bargain once you factored in their lifetime value. Never judge a campaign on a single metric.
- Ignoring device segmentation: A campaign can look like a total failure on paper. But slice the data by device, and you might discover that desktop performance is incredible while mobile is where you're burning your entire budget. Without segmentation, you risk cutting a winning strategy because its mobile performance is dragging down the average.
- Forgetting attribution: If you’re only looking at last-click attribution, you’re going to make top-of-funnel channels look like they're failing. A customer might discover your brand through a generic search, read your blog, and then finally convert a week later through a branded search. Giving 100% of the credit to that final click is just plain wrong, and it leads to gutting the very channels that are actually feeding your funnel.
The trap of analysis paralysis
The final pitfall is a personal one for a lot of ambitious founders: analysis paralysis. This is where you spend more time building beautiful, complex metrics and reports than you do actually acting on what they tell you.
Your goal isn't to build the perfect report. Your goal is to make one good decision. A simple report that leads to a smart action is infinitely more valuable than a comprehensive dashboard that just gathers digital dust.
Don't let the hunt for perfect data get in the way of making good decisions. Get the essential numbers, figure out the story they're telling you, and then do something about it. That's the only reason we're doing any of this in the first place.
The future of analytics is smarter not harder
Let's look ahead. The whole game of metrics and reports is getting a long-overdue upgrade. The days of manually pulling data into spreadsheets and staring at dashboards until our eyes glaze over? Their time is running out.
Thank god for that.
The future isn’t about drowning in more data; it’s about getting intelligent, automated insights. It’s about having the right information, with clear recommendations, handed to you exactly when you need it. As founders, this is the shift we’ve been waiting for—letting us get back to strategy and creative work while the machines do the heavy lifting.
The rise of intelligent automation
AI and machine learning are finally dragging analytics out of the past and into the future. Instead of just telling us what happened last week, the new wave of systems can start forecasting what’s likely to happen next.
This means technology can sniff out the winning ad combinations, predict which leads will blossom into high-value customers, and shift budgets on the fly without needing a human to babysit it 24/7.
Here’s what that looks like in practice:
- Predictive forecasting: Modern algorithms can chew through your past performance data to model future outcomes. This helps you make much smarter budget decisions before you’ve spent a single euro.
- Automated optimization: Imagine systems that can run thousands of A/B tests at once, automatically promoting the winners and killing the losers. We're talking about tools that handle the tedious optimization work for us. You can explore some of these next-gen Google Ads optimization tools to see how this is already a reality.
- A unified customer view: Finally, integrated platforms are making it possible to see the entire customer journey in one place. You can connect that very first ad click all the way through to their lifetime value in a single, coherent story.
This isn’t just some tech trend; it’s a fundamental shift in how businesses have to operate. Business analysis is now a core strategic function, with 76% of professionals reporting its growing impact within their companies. You can learn more about how data-driven insights anchor decision-making in modern organizations.
The future of reporting is proactive, not passive. It’s not a historical document; it's a strategic advisor telling you the next best move to make.
Leaning into this shift is how we stay competitive. It points to an optimistic future where technology doesn’t replace us but frees us up to build smarter, faster, and more efficient businesses.
Frequently asked questions about ad metrics
I get asked about PPC metrics and reports all the time. Let's get straight to it and clear up a few of the most common questions I hear from other founders.
How often should I check my metrics?
Don't get obsessed with the real-time dashboard. For live campaigns, a quick, five-minute daily check-in on core health metrics like CPA and conversion volume is smart. It’s just enough to spot any major fires before they burn down your budget.
Your real work happens in the weekly review. This is where you actually make decisions—analyzing trends, figuring out what’s working, and making strategic adjustments. The comprehensive monthly report is for the big picture: high-level performance analysis and planning your next budget cycle.
The goal isn't constant monitoring; it's rhythmic, intentional analysis. Focus on meaningful trends over time, not the noise of daily data fluctuations. Getting lost in the numbers is a great way to waste time and kill your focus.
What is a good ROAS for lead generation?
That question is impossible to answer without knowing your business inside and out. A "good" Return On Ad Spend (ROAS) depends entirely on your profit margins. There's no magic number that works for everyone.
- A common benchmark you’ll hear is 4:1—meaning you make €4 in revenue for every €1 spent on ads.
- But this varies wildly. A low-margin e-commerce business might need a 10:1 ROAS just to stay afloat.
- Meanwhile, a high-margin SaaS company might be thrilled with 3:1 because each customer's lifetime value is so high.
The only correct answer? Calculate your own break-even ROAS. Then, set your target to blow past it. That's your "good" number.
Should I improve CTR or conversion rate first?
Always, always prioritize improving the conversion rate. Both metrics are important, but they solve completely different problems, and one is far more expensive than the other.
A low Click-Through Rate (CTR) usually points to an issue with your ad copy or targeting—people just aren't clicking. But a high CTR paired with a low conversion rate is a direct hit to your wallet. It means you're successfully paying for clicks from people who lose interest the second they hit your landing page. You’re filling a leaky bucket.
Fixing the conversion rate has a much more direct and immediate impact on your bottom line. Stop the leak first, then worry about turning up the faucet.
At dynares, we build tools that connect your ad spend directly to revenue, helping you focus on the metrics that actually build your business. Stop guessing and start growing. See how dynares works.


