Let’s be honest, effective PPC reporting for clients isn’t about sending a bloated PDF filled with vanity metrics. It's about delivering a clear, concise story that connects ad spend directly to revenue. It’s the difference between showing clicks and proving you generated tangible business growth—which is the only thing that actually matters.
Why most PPC reporting is a waste of time
Most PPC reports are fundamentally broken. They’re a relic of an old agency model, designed to look impressive while saying almost nothing of value.
I’ve seen countless agencies send 20-page documents choked with jargon and fluff like impressions, reach, and click-through rates. Frankly, it’s a dumb approach that actively erodes trust.
This method is just plain lazy. It uses data as a shield, burying clients in numbers to make it seem like complex work is happening. But any founder or CEO worth their salt sees right through it. They aren't paying you to generate clicks; they're paying you to grow their business. When your report doesn't speak that language, you’re just wasting everyone's time.
The mindset shift: from data dumps to business impact
The problem isn't the data itself. It's the lack of a narrative that connects the dots to what actually keeps a business owner up at night. Your client is thinking about customer acquisition cost, return on ad spend, and pipeline value. Your report needs to reflect that reality.
To really nail this, you have to start by understanding what paid search advertising entails and its specific role in their growth strategy.
Before you even touch a dashboard or a template, you need to change your mindset. Your job isn't to report on clicks. It's to report on the cash-in-the-bank impact of those clicks. If you can't draw a straight line from your ad spend to their revenue, you're failing them.
This isn't about just adding a new chart to your Looker Studio dashboard. It’s a fundamental reframe. When you present a report, you’re not just a campaign manager; you’re a strategic partner contributing to their bottom line.
What your clients actually care about
Forget what Google Ads tells you is important for a moment. After scaling multiple businesses and sitting on both sides of the table, I can tell you what founders and executives actually want to know.
It’s way simpler than you think.
- How much did we spend?
- How much revenue did that spend generate?
- Are we on track to hit our larger business goals?
Everything else is just noise. Every single metric you include should serve to answer one of those three questions.
This is where so many agencies get it wrong—they try to justify their existence with complexity. The best partners I’ve ever worked with do the exact opposite. They deliver absolute clarity. By simplifying your reporting, you elevate the conversation.
Of course, using the right Google Ads optimization tools is critical to generating results worth reporting on in the first place.
Alright, let's get practical. It's time to ditch the bloated, 20-page PDFs that nobody—and I mean nobody—actually reads. We’re going to build one clean, powerful dashboard that tells a story at a glance.
Think of it as the single source of truth for you and your client.
This isn't about flexing every metric Google Ads offers. It’s about ruthless simplification. The goal is a dashboard that a busy CEO can look at for 60 seconds and understand exactly where their money is going and what it’s achieving. If it requires a 15-minute explanation, you’ve already failed.
I’m a big fan of Looker Studio (the tool formerly known as Google Data Studio). It’s free, powerful, and plugs right into the Google ecosystem. It’s the perfect place to build this foundational dashboard without adding another subscription to your tech stack.
Separating signal from noise
The first job is deciding what actually gets a spot on this prime real estate. Every single chart or number has to earn its place by answering a critical business question. We’re filtering for signal, not noise.
Your client doesn’t care about impressions. They care about profit. So, let’s build our dashboard around metrics that track directly to their bottom line.
A great dashboard doesn't just present data; it provides answers. The main answer your client is looking for is, "Was this investment worth it?" Make sure your dashboard screams "YES" with evidence. Everything else—CTR, CPC, impression share—is secondary. They are diagnostic metrics, useful for you to explain performance, but they are not the headline. They are the footnotes to the main story.
Essential KPIs vs vanity metrics for your dashboard
This table should help you distinguish between metrics that truly matter for business growth and those that just look good on paper.
Metric CategoryEssential KPI (Focus on This)Vanity Metric (Avoid This)EfficiencyReturn on Ad Spend (ROAS)Click-Through Rate (CTR)CostCustomer Acquisition Cost (CAC)Cost Per Click (CPC)VolumeTotal Conversion ValueImpressionsOutcomeNumber of New CustomersClicks.
Focusing on the left column keeps your conversations centered on business impact. The right column contains useful diagnostic tools for you, but they often just create noise for the client.
Structuring your dashboard for clarity
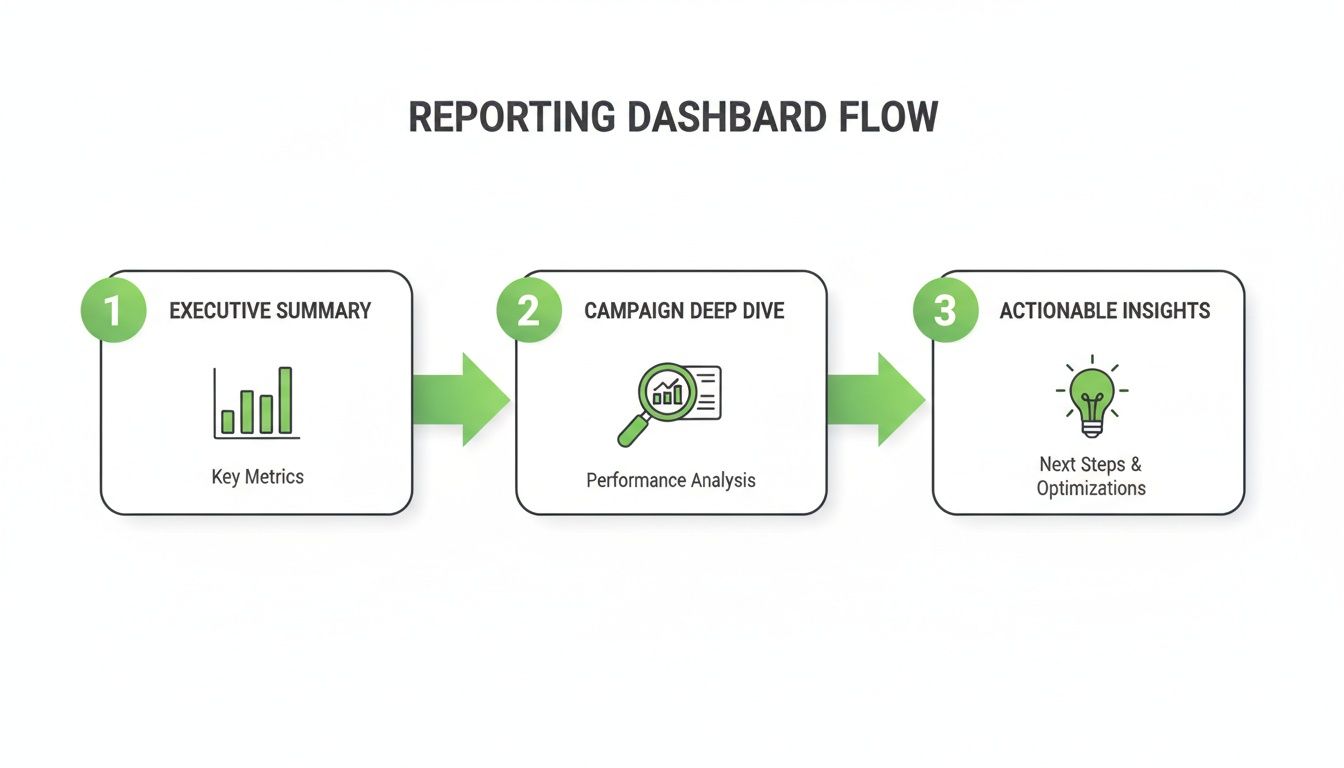
I build my foundational dashboards with a simple top-down logic. Start with the big picture and allow for a drill-down into the details. Think of it like a newspaper: headline first, details later.
A logical flow makes the data digestible. Here's a simple, effective structure I use all the time:
- The Executive Summary (Top Fold): This is the most important part. It should show the three or four most critical KPIs at a glance—total spend, total revenue/conversion value, ROAS, and CAC. Throw in a date range selector so you can easily compare performance over time.
- Performance Trends: Right below the summary, show trend lines for these key metrics over the selected period. This visualizes momentum. Is ROAS trending up? Is CAC coming down? This is where the story starts to unfold.
- Campaign & Ad Group Breakdown: Finally, include a simple table that breaks down performance by campaign or ad group. This section answers the "why" behind the top-level numbers. It shows which specific initiatives are driving the best results.
This structure respects your client's time while providing the necessary depth for strategic conversations. They get the highlights immediately and can dig deeper if they want to.
And of course, accurate tracking is the bedrock of all of this. Ensuring your conversions are firing correctly is non-negotiable, which is why a solid setup is so critical. For those getting started, you might be interested in our guide on how to use Google Tag Manager to get your tracking right from day one.
Adding context with benchmarks
Finally, context is everything. Raw numbers need a reference point to have any meaning. That's where benchmarks come in.
For example, Google Ads is still the undisputed king of PPC, with 98% of professionals using it. Knowing that the industry average ROAS often hovers around 200% ($2 for every $1 spent) helps your client understand where their performance stands. Highlighting that your campaigns are hitting a 4-5x ROAS suddenly looks even more impressive.
You can even mention that tools like Smart Bidding can deliver a 19% conversion boost, connecting your optimization efforts directly to their bottom line. Check out some of the latest benchmarks to learn more about these fascinating 2025 Google Ads findings. This context transforms raw data into a powerful narrative of your agency's value.
Automating data to focus on strategy
If you're still manually copy-pasting numbers into spreadsheets for your client PPC reports, you’re not just wasting time—you’re actively kneecapping your agency's potential.
Let's be brutally honest: data entry is a low-value task that should have been automated years ago. It’s 2024, not 2004. Your value isn't in your VLOOKUP skills; it's in your strategic brain.
Automation isn't some futuristic luxury; it's the bare minimum for operating a modern, scalable agency. Manually pulling data is tedious, prone to human error, and frankly, a terrible use of your team's talent. Every hour spent on that is an hour not spent analyzing performance, finding new growth opportunities, or talking to your clients about their business.
When you’re juggling multiple accounts, this becomes non-negotiable. Building an automated system is how you reclaim your time to focus on what actually moves the needle—insights and strategy.
Building your automated data pipeline
The goal here is simple: create a seamless flow of data from its source directly into your reporting dashboard, with zero manual intervention. This pipeline should pull from all the relevant places—Google Ads, Google Analytics, your client's CRM—and refresh automatically. This ensures your reports are always live, accurate, and ready for a conversation.
My setup is straightforward and doesn’t require a team of data engineers. It’s about using the right tools to connect the dots.
- Data Source Connectors: Think of these as the bridges that link your ad platforms to your dashboard. Tools like Supermetrics or the native connectors within Looker Studio are perfect for this. They do the heavy lifting of pulling raw data via APIs.
- A Centralized Dashboard: As I mentioned before, Looker Studio is my go-to. It’s free and connects directly to Google's ecosystem, which covers the majority of use cases. This is where all your data streams converge into a single, cohesive view.
- Scheduled Refreshes: This is the magic button. Set your data sources to refresh daily or even hourly. This ensures that whenever you or your client logs in, you’re looking at the most up-to-date information, not a stale snapshot from last week.
This setup transforms your dashboard from a static document into a living, breathing tool for decision-making. The point of automation isn't just to be more efficient. It's to create a system so reliable that you can completely trust the numbers, freeing up your mental energy to think about the story those numbers are telling.
This process ensures that anyone viewing the report can quickly grasp the key takeaways and understand the proposed actions without getting lost in the data.
Moving beyond spreadsheets for good
The real breakthrough comes when you stop thinking of reports as something you create and start seeing them as something that exists. An automated dashboard is always on, always accurate. It eliminates the entire song and dance of exporting CSVs, cleaning data, and emailing attachments.
This shift has a profound impact on your client relationships.
Instead of a formal, periodic review, performance conversations can happen fluidly and spontaneously. A client can call with a question, and you can both pull up the live dashboard to find the answer together, in real-time. This level of transparency and immediacy builds incredible trust.
If you’re still stuck in spreadsheet hell, it’s time for an intervention. You can explore our thoughts on moving from spreadsheet hell to automated PPC funnels with AI to get a deeper look at this transition. It’s not just a nice-to-have; it's a foundational piece of a scalable, future-proof agency. The sooner you embrace it, the faster you can focus on high-impact strategic work.
Crafting the narrative around your data
Alright, you’ve built a clean dashboard. Your data pulls are automated. Most agencies stop right here, dust off their hands, and call it a day.
This is a huge mistake. And it’s your biggest opportunity to stand out.
A dashboard full of numbers is just noise. It shows the what—clicks went up, CPC went down. But your client isn't paying you to read charts. They're paying you for the why and, more importantly, the what's next.
This is where you add the human layer. Data without a story is meaningless. It’s your job to translate those numbers into a narrative that ties directly to their business goals. This is what turns a static report into a strategic conversation. It’s how you become an indispensable partner, not just another vendor.
From data points to strategic insights
Most PPC reports fail because they stop at observation. They just regurgitate numbers from the ad platform. That’s not analysis; that’s just reading.
To provide real value, you have to go deeper.
I use a simple framework that forces you to think strategically. It’s not revolutionary, but it works every single time. I call it the O-I-R framework:
- Observation: What does the data explicitly show? This is the objective fact. For example, "Our main campaign's Click-Through Rate increased by 25% this month."
- Insight: What does this actually mean? This is the so what behind the number. For example, "This tells us the new ad copy is resonating far better with our target audience, driving more qualified traffic."
- Recommendation: What should we do about it? This is the actionable next step. For example, "We recommend reallocating 15% of the budget from underperforming campaigns to this winner to scale our success."
This little framework turns a dry data point into a strategic plan. It proves you’re not just monitoring performance; you’re actively steering the ship.
Writing an executive summary that actually gets read
Your client is busy. Assume the only thing they will read is the executive summary at the top of your report or email. It needs to be concise, direct, and valuable.
Forget the long-winded intros. Get straight to the point. Structure your summary to answer three questions immediately: Key Wins, Challenges & Learnings, and Action Plan. This shows you’re already thinking ahead and have a plan. The goal of your narrative isn't to justify your fee. It's to provide so much strategic clarity that the fee becomes an afterthought. You're selling confidence, not clicks.
Context is also your best friend here. For instance, recent shifts in Google's Performance Max finally give us deeper channel reporting and asset-level insights, killing the old black box frustration. This lets you present granular proof of your value.
Showing a client that their automotive campaigns hit an 8.29% CTR at a $2.41 CPC, crushing the industry's average CPC of $5.26, is a concrete demonstration of smart spending. Find out more about what Google's changes mean for the future of PPC.
When you craft a strong narrative, you stop being the Google Ads person and become the growth partner they can't afford to lose. It's the most powerful retention tool you have.
Connecting ad spend directly to revenue
Alright, let's talk about the final frontier of PPC reporting. This is where you graduate from being a campaign manager to a genuine growth partner.
Cost Per Lead (CPL) is a fine starting point, but it's an intermediate metric. The real conversation—the one that secures six-figure contracts and builds decade-long partnerships—is all about revenue.
How do you prove the leads you generate are actually making your client money? This is where the magic happens.
The ultimate goal is to shift the dialogue from, "How many leads did we get?" to, "How much revenue did our ad spend generate?" This is how you justify your fees, secure bigger budgets, and build truly unbreakable client relationships. It’s the difference between being a line item and being an investment.
Integrating with the client's CRM
This is the non-negotiable first step. If you're not connected to your client’s CRM (like HubSpot, Salesforce, etc.), you're flying blind. You have zero visibility past the initial lead submission—like watching the first 10 minutes of a film and guessing the ending.
Integrating with their CRM lets you track a lead's entire journey, from that first ad click all the way to the final, signed contract. It closes the loop.
This isn’t just a technical task; it's a strategic alignment. It requires collaboration with your client's sales team and a shared understanding of what makes a lead qualified versus what makes a deal closed. This process alone will teach you more about their business than a year's worth of campaign data.
The power of offline conversion tracking
Once you have that CRM integration, the next move is a total game-changer: uploading offline conversion data back into Google Ads.
This is where you tell Google, "Hey, that lead from last month? The one that looked just like the others? It just turned into a €50,000 deal." You're feeding real-world sales data back into the machine.
Suddenly, Google's algorithm isn't just optimizing for form fills anymore. It's optimizing for profit. The platform starts learning the patterns and characteristics of users who not only convert but become high-value customers. This is how you unlock true value-based bidding. This simple act of uploading offline conversions transforms Google Ads from a lead generation tool into a revenue-driving engine. You stop chasing cheap leads and start hunting for profitable customers. It's the single most impactful optimization you can make for a B2B client.
Implementing this requires some technical setup, but it’s not rocket science. It's also crucial for accurate attribution. If you need to nail the technical side, check out our detailed guide on setting up Google Ads conversion tracking.
Shifting to value-based bidding
With real sales data flowing back into your ad account, you can finally move away from outdated bidding strategies like "Maximize Clicks" or even "Target CPA." It’s time to focus on what actually matters.
- Maximize Conversion Value: This strategy tells Google to get the most revenue possible within your budget. It's perfect when you don't have a specific ROAS target but want to maximize total income.
- Target ROAS (tROAS): This is for when you have a clear profitability goal. You tell Google, "For every euro I spend, I need to get at least five euros back," and the algorithm adjusts bids in real-time to hit that target.
This shift has a massive impact on your reporting. You can now confidently show a client how you're not just managing their spend but actively optimizing it for profitability. Connecting ad spend to revenue means clients see the real return, and a practical guide on how to measure marketing ROI can help frame that conversation perfectly.
Proving your worth with full-funnel data
This complete feedback loop changes everything. Your reports are no longer about surface-level metrics. They’re about business impact.
The data backs up your strategy in a powerful way. While the average CPL in Google Ads is around $70.11, your reports can show that while your CPL might be $90, those leads generate 5x more revenue than the cheaper ones. This is how you prove your value. Businesses typically earn $2 for every $1 spent on Google Ads, but with this model, you can aim for outlier returns of 8:1.
It’s no wonder that 70% of advertisers call Google Ads their top ROI channel; when you connect it to revenue, the value becomes undeniable. For a closer look at the benchmarks that matter, discover more insights about these Google Ads stats. This approach transforms your reporting from a cost-center discussion to a profit-center celebration.
Answering the tough questions about client reporting
Alright, let's get into the questions that always come up in the real world. Forget the fluff. These are the practical, sometimes uncomfortable conversations you need to be ready for, based on years of building and scaling agency operations.
How often should I send PPC reports to clients?
First, get the idea of a rigid, monthly PDF out of your head. That's a relic from a different era. The right reporting cadence isn't about your schedule; it's about the client's needs and the intensity of the campaigns you’re running. A one-size-fits-all approach is just lazy.
The real answer? It depends entirely on the situation.
The frequency of your PPC reporting should match the velocity of your decision-making. If you're making big changes weekly, you need weekly touchpoints. If the strategy is set for the quarter, a monthly deep-dive is more than enough. The golden rule here is that the report itself is just an excuse for a strategic conversation. Always prioritize the discussion over the document. The goal is alignment, not just delivery.
What is the best tool for PPC client reporting?
Honestly, anyone who tells you there's one "best" tool is probably trying to sell you something. The best tool is the one that fits your agency's workflow and helps you deliver clarity, period. It’s the craftsman, not the hammer, that matters.
For most agencies, the choice is actually pretty simple. For 90% of cases, Looker Studio (formerly Google Data Studio) is the answer. It's free, it's powerful, and it plugs directly into the entire Google ecosystem. As you scale, you might eventually look at paid platforms like DashThis or ReportGarden. They offer more advanced integrations that can be a lifesaver for larger agencies.
But don’t get distracted by shiny objects. The platform you use matters far less than the quality of your insights. A simple, clear report in Looker Studio is infinitely more valuable than a confusing, bloated dashboard from a pricey tool.
How do I Report on poor performance?
Sooner or later, a campaign is going to tank. It happens to everyone. How you handle this moment is what defines your relationship with the client. Most agencies get defensive or try to hide the numbers in a footnote. That’s a one-way ticket to getting fired.
Your best assets here are radical honesty and proactivity. You have to own the narrative.
- Get Ahead of It. Address the bad news before the client has to ask. Bring it up yourself, on your terms. This immediately diffuses tension and shows you’re on top of the situation.
- Frame It as a Learning. Poor performance isn't a failure; it's expensive data. It tells you what not to do, which is incredibly valuable. Your report should clearly state what happened, your hypothesis for why it happened, and your concrete action plan to fix it.
- Demonstrate Your Strategic Value. This is your chance to shine. By presenting a clear, confident plan, you transform a negative result into a powerful demonstration of your strategic thinking. This builds more trust than a month of good results ever could.
At dynares, we built our entire platform around this idea of connecting ad spend directly to revenue. It's not just about generating leads; it's about generating profitable customers. Our system automates the creation of high-intent ads and landing pages, and crucially, uploads conversion values back to Google Ads, so you’re always optimizing for what truly matters—the bottom line. See how dynares works.


