How to Optimize Website Conversions and Stop Burning Cash on Clicks
You're pumping a fortune into Google Ads, the clicks are rolling in, but the leads or sales just aren't keeping up. It feels like you're setting money on fire—and let's be blunt, you probably are.
The real problem isn’t your traffic; it’s what happens after the click.
Your leaky funnel is costing you a fortune
Most companies treat their landing pages like a generic afterthought. It’s an expensive mistake. You’ve already done the hard part of getting someone interested enough to click, only to let them slip through your fingers because your post-click experience is broken.
The secret to growth isn't more traffic; it's getting more from the traffic you already have.
That shift in mindset is the bedrock of any serious growth strategy. It’s time to stop pouring water into a leaky bucket and start plugging the holes. This guide will walk you through a baseline audit that’s actually useful, using tools you already have to find exactly where your funnel is bleeding cash.
This flowchart shows the painful reality of paid traffic: clicks pour in, but small leaks in the user journey drain potential revenue before you ever see real growth.
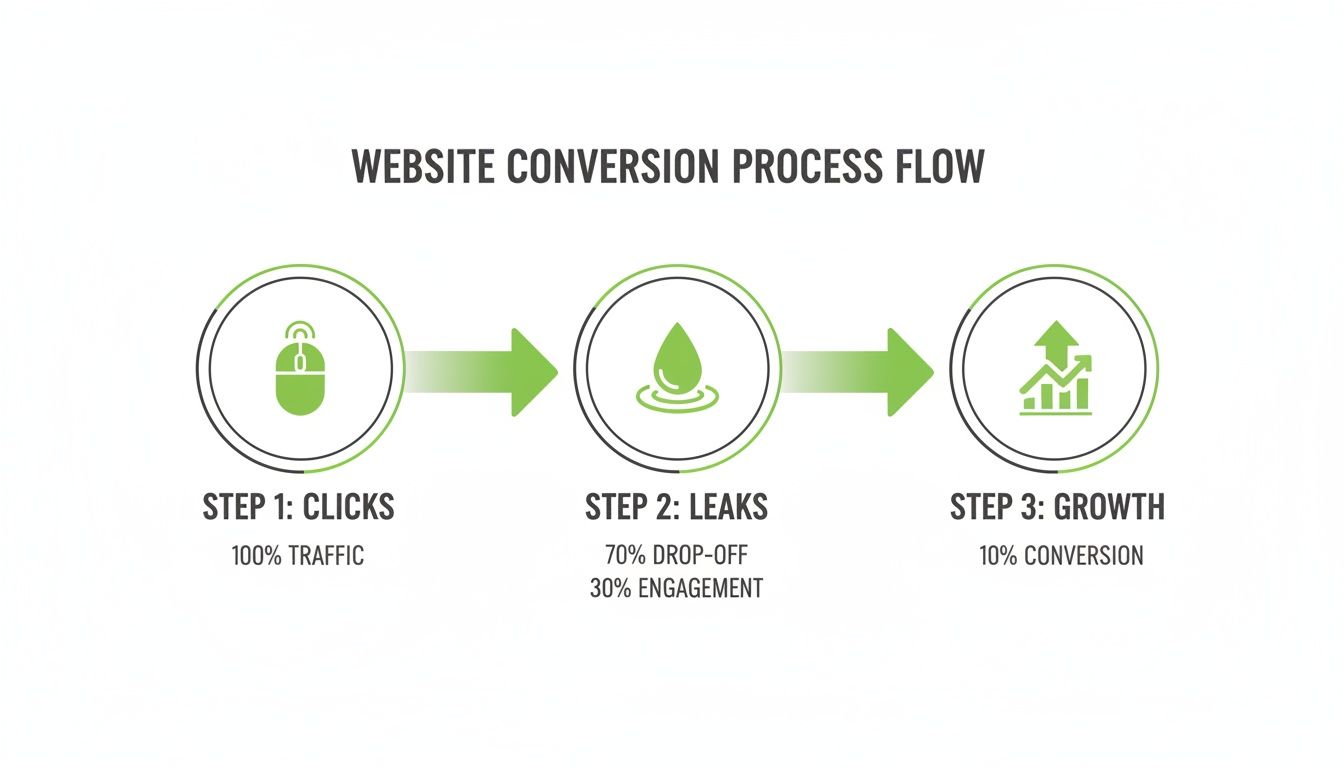
It’s a stark reminder that even tiny leaks compound into massive losses. This is why conversion optimization is the highest-leverage activity you can possibly focus on.
The real cost of a broken post-click experience
Every visitor who lands on your page and leaves without converting isn't just a missed opportunity; it's wasted ad spend you can never get back.
Let’s say you spend €10,000 a month on ads. If your conversion rate is a dismal 1%, you're effectively burning thousands on clicks that go nowhere. But if you double that rate to 2%, you don't just double your leads—you cut your cost per acquisition in half. That’s the kind of efficiency that lets you scale aggressively.
We need to treat post-click optimization with the same intensity we give to ad creative and keyword bidding. It’s where the money is made or lost.
The most expensive traffic in the world is the traffic you don't convert. It's a simple truth too many marketers forget while chasing vanity metrics like clicks and impressions.
Building a foundation with a proper audit
Before we start messing with button colors and rewriting headlines, we need a diagnosis. A proper audit isn’t about guesswork; it’s about gathering cold, hard data to tell us where the biggest problems are. It’s the essential first step to optimize website conversions effectively.
A solid baseline audit really comes down to three things:
- Quantitative analysis: Using tools like Google Analytics to find out what is happening. Where are users dropping off? Which pages have the highest exit rates?
- Qualitative analysis: Using heatmaps, session recordings, and surveys to understand why it's happening. Are users confused? Is the form too long? Do they trust your site?
- Heuristic analysis: A common-sense walkthrough of the user journey to spot obvious friction. Does the page load like molasses? Is the call-to-action clear?
This initial audit provides the raw material for everything that follows. Without this data-driven foundation, you're just throwing ideas at a wall and hoping something sticks.
If you're looking for a structured approach, you can learn more about how to run a complete conversion rate optimisation audit in our dedicated guide. Let's build something smarter. 🚀
Craft a hypothesis that isn't just a wild guess
So you’ve found the leaks in your funnel. Great. The next mistake everyone makes is randomly changing things.
‘Let’s make the button green!’ is not a strategy—it’s a great way to waste time and budget. A real plan to optimize website conversions is built on solid hypotheses, not guesswork.
This is where you turn your audit data into smart, actionable ideas. You need to dig into the heatmaps, session recordings, and user feedback to understand the why behind the drop-offs. Is the headline confusing? Is the form ridiculously long? Is your value prop buried six paragraphs deep?
You have the data. Now it's time to connect the dots.

A framework for better ideas
To stop the random guessing, use a simple but powerful framework for every single test idea. It forces you to be crystal clear and ties every change back to a user problem and a measurable outcome.
By changing [X] because of [Y observation], we expect [Z outcome].
This structure is my go-to. It keeps you from testing pointless things and makes sure every experiment teaches you something valuable, whether you win or lose.
Let’s apply this to a typical B2B lead gen page where we spotted a huge drop-off on the demo request form using session recordings. Here are a few high-impact hypotheses we could cook up:
- Hypothesis 1 (Reduce Friction): By reducing the number of form fields from nine to four, because we observed users abandoning the form after the fifth field, we expect a 20% increase in form submissions.
- Hypothesis 2 (Clarify Value): By changing the headline from ‘Our Software’ to ‘Stop Wasting Ad Spend Today’, because heatmaps show low engagement with the current headline, we expect a 15% decrease in bounce rate.
- Hypothesis 3 (Build Trust): By adding customer logos directly above the CTA, because user surveys mentioned a lack of trust signals, we expect a 10% lift in demo requests.
This structured approach lets you prioritize tests based on their potential impact and the strength of your evidence. It’s a game-changer.
Did you know that in 2025, the average website conversion rate is around 2.9%? But for B2B lead generation, it skyrockets to anywhere between 1.7% and 10.8%. That massive range shows just how much potential there is when you get this right.
Now you have a backlog of smart ideas, not just a random to-do list. The next job is figuring out which type of experiment is right for the job. You can learn more about the differences between multivariate and A/B testing to make the best choice.
Tailor your copy and layout for user intent
Alright, this is where the real work begins. Your landing page isn't some digital brochure to be admired from afar. It's a one-on-one conversation with a potential customer who just typed a specific problem into Google. You absolutely have to match what they're looking for, or you've lost them the second they arrive.
Think about it. Someone searching for "emergency plumbing services" needs a phone number, front and center. They want a big, obvious button that says "Call Now". They couldn't care less about your company's long-winded origin story. You have to get straight to the point, fast.
This tight alignment between the ad they clicked and the page they land on is called message match. If your ad promises a "free B2B sales template", the headline on your landing page better scream, "Your Free B2B Sales Template". Anything else creates a disconnect, kills trust, and sends your bounce rate through the roof.
The critical elements of a page that converts
Let's cut right to it. High-converting pages aren't magic; they're systems. They are built from a few core components that have to work together perfectly. If you're missing even one of these, you are leaving money on the table.
- A killer headline and sub-headline: This is non-negotiable. It must immediately confirm the user is in the right place and clearly state your unique value proposition. No fluff.
- Compelling social proof: Think customer logos, short testimonials, or specific case study stats. People trust other people's experiences way more than they trust your marketing copy.
- A single, unmissable call-to-action (CTA): Don’t give users a buffet of options. Tell them the one single action you want them to take and make that button impossible to ignore.
Getting these fundamentals right is 80% of the battle. You can waste weeks tweaking button colors, but if your core message is weak or your CTA is buried, no amount of fiddling will save the page.
Your form is probably too long
Let's talk about forms because this is where so many companies get it completely wrong. Asking for 15 fields on a first touch is insane. It's the business equivalent of asking for someone's life story on a first date—it’s just too much, too soon.
Every single field you add introduces friction and gives someone another reason to abandon the process. Strip your forms down to the absolute bare essentials. For a first contact, do you really need their company size and annual revenue? Probably not. An email and maybe a first name are often more than enough to get a conversation started.
Here’s a practical way to rethink your forms:
- Audit every field: Ask yourself, "Is this information absolutely critical for the very next step in our sales process?" If the answer is no, kill it.
- Use multi-step forms: If you absolutely must collect more data, break it into smaller, more manageable chunks. Asking for contact info on step one and company details on step two feels far less intimidating.
- Leverage smart defaults: Use technology to pre-fill information whenever possible. The less someone has to type, the better your chances are of getting that conversion.
Building a landing page is a crucial piece of the conversion puzzle. To dive deeper into the nuts and bolts, check out our complete guide on landing page design best practices for more actionable insights. This isn't just about building one page; it's about building a scalable system for growth. 🚀
Run experiments that actually teach you something
So, you’ve got your hypothesis and a new page variant ready to roll. Now for the fun part: testing. A/B testing is completely non-negotiable for any serious effort to optimize website conversions, but it has to be done right. If not, you’re just burning through valuable traffic.
A clean A/B test is all about isolating variables. Seriously, don’t change the headline, the button color, and the main image all at once. If that Frankenstein variant wins, you’ve learned absolutely nothing about why it won.
Test one significant change at a time. This is where patience really pays off.

From manual slog to intelligent automation
The old way of doing this was clunky and painfully slow. You’d have to manually set up a 50/50 split, wait weeks (or longer) to reach statistical significance, and then get a developer to push the winner live. It was a tedious process that severely limited how much you could actually learn.
This is where modern AI-powered tools are a complete game-changer. They can automate the entire testing process, creating multiple variants and dynamically shifting traffic to the winning versions in real-time. It’s like having a hyper-efficient optimization expert working for you 24/7, freeing you up to focus on strategy instead of tedious setup.
The goal isn't just to find a winning page; it's to learn what resonates with your audience. Every test, win or lose, should give you an insight that makes your next hypothesis even smarter.
This brings up another critical point: you have to run your tests long enough to get clean data. Calling a test after two days because one version is slightly ahead is a classic rookie mistake. You need enough traffic and time to reach statistical significance—usually at a 95% confidence level—to be sure your result isn't just random luck.
Segment your results for deeper insights
A test result might show a small lift overall, but the real gold is often hiding in the segments. Your new messaging, for instance, might be a complete dud with mobile users but a massive hit with desktop visitors. Without segmentation, you’d never know.
Speaking of devices, the performance gap is huge. Desktop users are expected to convert at 4.8% compared to a measly 2.9% on mobile in 2025, even though mobile traffic dominates. This isn't just a random stat; it's a clear signal that user intent and context are wildly different across devices. You can explore more of these ecommerce benchmarks on SpeedCommerce. You absolutely have to account for this in your experiments.
Here's a quick look at why digging into device data is so important.
Desktop vs mobile user behavior
| Metric | Desktop | Mobile | Key takeaway |
|---|---|---|---|
| Average Session Duration | 3-4 minutes | 1-2 minutes | Desktop users have more time and patience for in-depth content. |
| Conversion Rate | ~4.8% | ~2.9% | Users are far more likely to complete complex actions on a larger screen. |
| User Context | Focused, task-oriented | On-the-go, distracted | Mobile experiences must be incredibly simple and direct to succeed. |
| Form Submissions | Higher completion rates | Higher abandonment rates | Long or complex forms are a conversion killer on mobile. |
As you can see, treating these two segments as one homogenous group is a recipe for inconclusive tests and missed opportunities.
When you analyze your test results, always break them down by device type, traffic source, and new versus returning visitors. Their motivations are completely different.
This level of analysis turns a simple A/B test from a coin flip into a powerful research tool. You’re not just looking for a winner; you’re building a deep, actionable understanding of your customer. That’s how you build a real growth engine.
Close the loop with tracking and revenue data
Let’s talk about the one step most marketers skip. It’s the final piece of the puzzle, and it's what separates the amateurs from the pros who build predictable revenue engines.
Getting a lead is great, but let's be real—not all leads are created equal.
A demo request from a CEO at a Fortune 500 company is infinitely more valuable than a student downloading a whitepaper for a research project. Yet, without the right feedback loop, Google’s algorithm treats them both the same. It’s a dumb way to run your campaigns.
If you aren't telling Google Ads which leads turn into actual revenue, its algorithm is flying blind. It will diligently optimize website conversions for quantity, not quality, chasing cheap leads that never close and burning your budget in the process.
From cost per lead to return on ad spend
This is where you need to shift your entire focus from Cost Per Lead (CPL) to Return On Ad Spend (ROAS). The only way to do that is by closing the loop and feeding real business data back into the ad platform.
Uploading conversion values tells Google’s machine learning what it’s best at: finding more of your most valuable customers. It’s like giving a world-class salesperson your ideal customer profile and letting them loose. You’re no longer just buying clicks; you’re investing in outcomes.
A campaign optimized for CPL will get you a lot of leads. A campaign optimized for ROAS will get you a lot of customers. Don't confuse the two. One keeps you busy; the other makes you profitable.
Automating the feedback loop
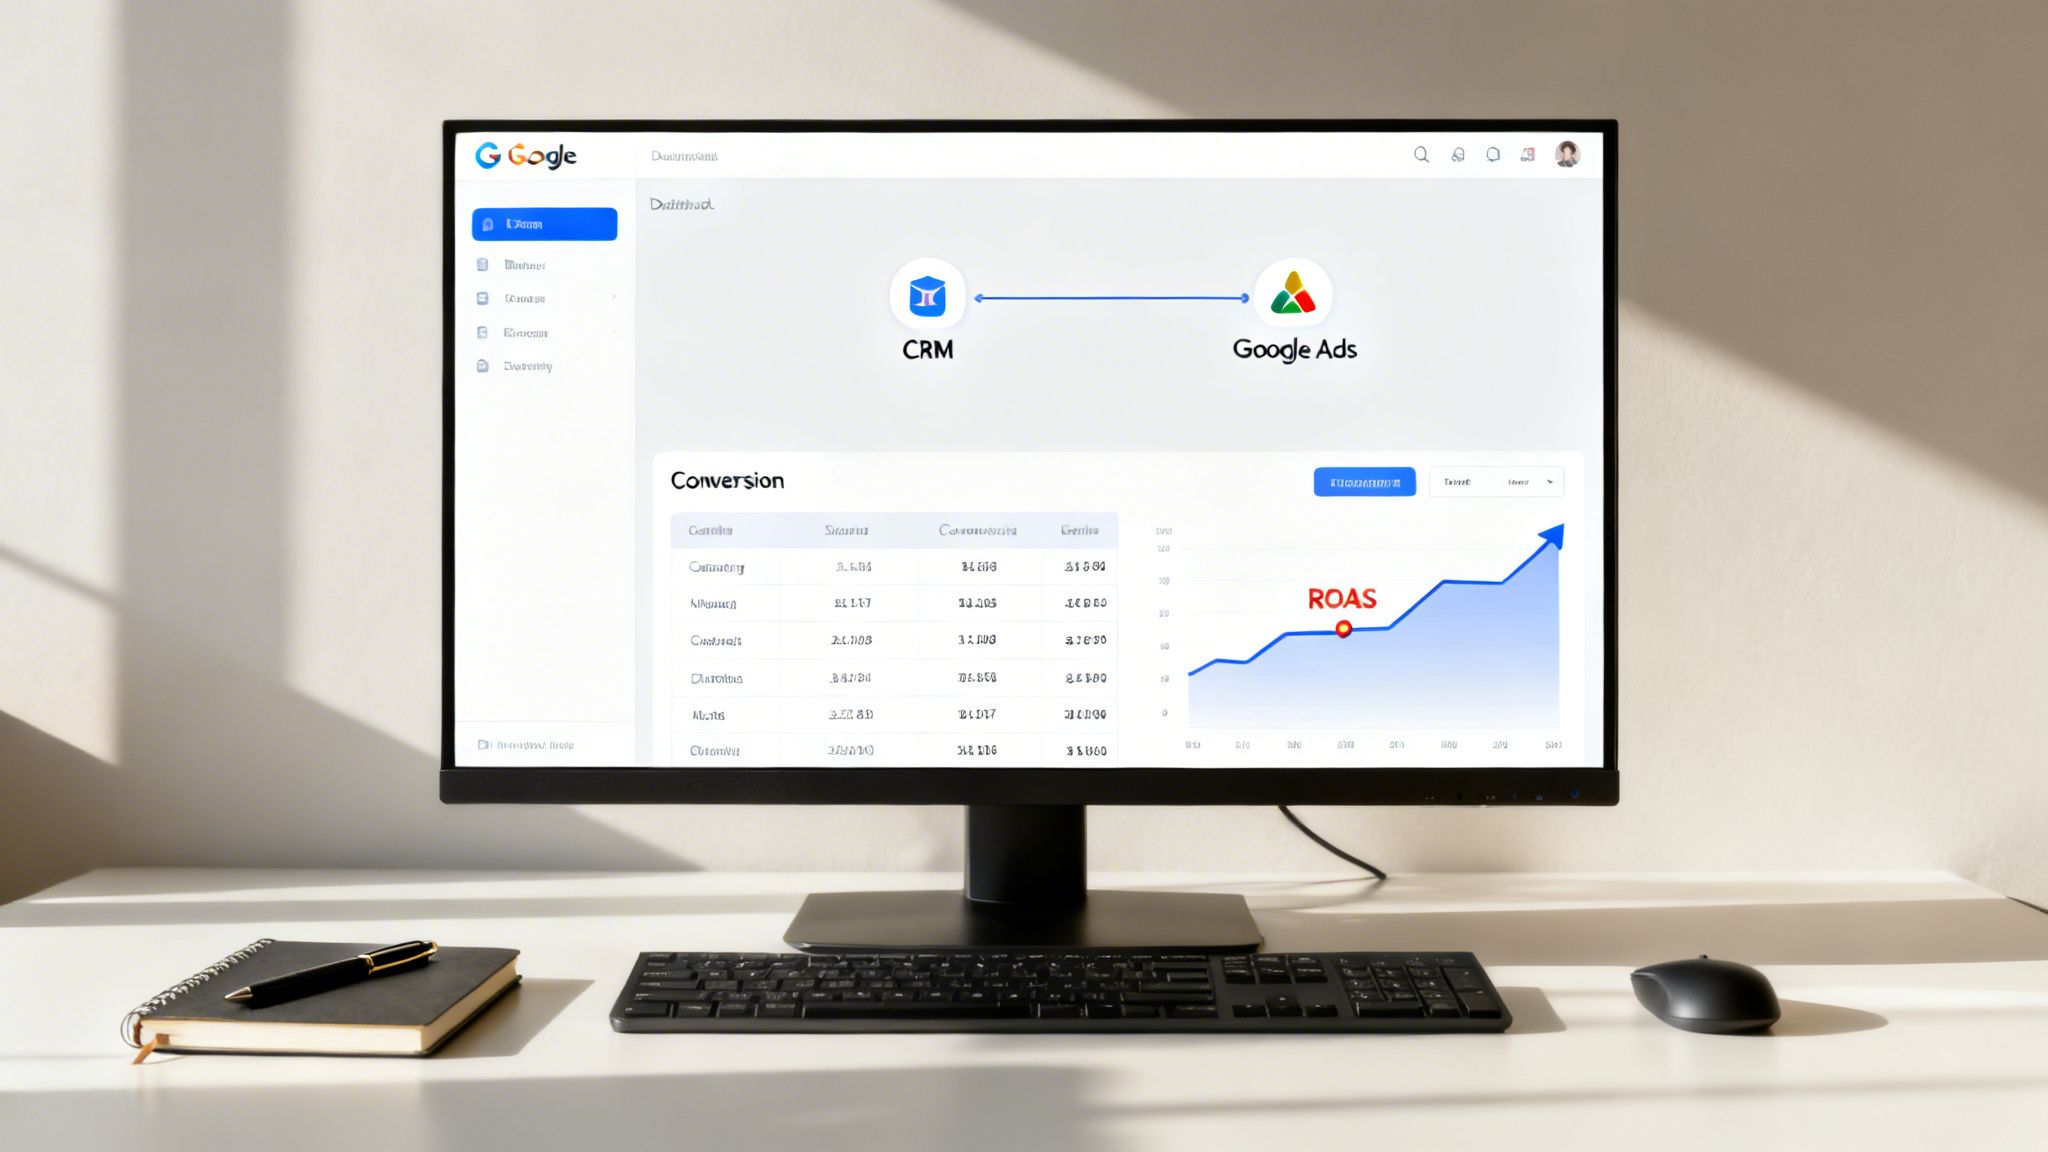
Manually exporting sales data and uploading it is a headache nobody has time for. This is where modern platforms come in clutch. By connecting your CRM directly with your ad accounts, you can automate this entire process.
The system automatically passes revenue data from closed deals back to Google Ads, assigning a real monetary value to the original conversion. It’s a seamless flow of information that makes your entire operation smarter.
For a deeper dive into the mechanics, our guide on setting up Google Ads conversion tracking is a great place to start.
This single step is a game-changer. It aligns your marketing efforts directly with business goals, ensuring every euro spent is working as hard as possible to generate real, measurable ROI.
This is how you build a truly scalable and intelligent paid acquisition machine. 🚀
Frequently asked questions about website conversions
Let's cut through the noise. When you get serious about optimizing website conversions, a lot of the same questions tend to pop up. Here are some direct, practical answers to the ones I hear most often from other founders, PPC managers, and agency owners.
How long should I run an A/B test?
The honest answer isn't a simple number of days. You need to run a test until you reach statistical significance, which is usually a 95% confidence level. This just means you're 95% sure the result wasn't a random fluke.
Practically speaking, you should let the test run for at least one full business cycle—a full week or two is a good starting point—to smooth out any weird daily fluctuations in traffic or behavior. A good testing tool will tell you when you've hit significance.
Stopping a test early just because one variant is ahead is a classic mistake. It's like calling a football match after ten minutes. You'll get burned by false positives and end up implementing "winning" changes that do absolutely nothing.
What's a good conversion rate to aim for?
This is the wrong question to ask. A "good" rate is completely dependent on your industry, traffic source, price point, and what you're offering. B2B lead gen for a high-ticket service can see rates from 2% to over 10%, while a complex e-commerce sale might be doing great at 3%.
Chasing some generic, abstract number is a dumb waste of energy. The only benchmark that truly matters is your own.
Focus on your baseline: If you’re at 1% today, the real goal is 1.5%. Then 2%. The objective is continuous improvement, not hitting an arbitrary industry average someone posted on Twitter. Small, consistent wins compound into massive gains over time.
Instead of obsessing over competitor vanity metrics, obsess over beating your own performance from last month. That's how you actually build a scalable business.
Can I do this without a big budget or a dedicated team?
Absolutely. You don't need a massive team if you have the right tools and a smart process. This is exactly where technology comes in to level the playing field for lean, ambitious teams.
Many modern platforms are built to automate the tedious parts, like generating landing page variants and running the tests for you. This frees you up to focus on strategy and creative, not manual grunt work.
The key is to be systematic, not resource-heavy. Start with a simple audit using free tools like Google Analytics. Form one or two strong hypotheses based on what you find. Test them methodically. Repeat. 🔁
You don't need a huge budget to get started. You just need a disciplined process and the right technology to make every click and every dollar count. Even small, consistent improvements will eventually put you miles ahead of competitors who are just burning cash without a plan.
At dynares, we built our platform to solve this exact problem—automating the creation, testing, and optimization of paid search landing pages so you can focus on strategy, not manual work. If you’re tired of wasting ad spend on underperforming pages, see how AI can build a high-converting system for you at https://dynares.ai.


