Customer Engagement Metrics That Actually Drive Revenue
Customer Engagement Metrics That Actually Drive Revenue
Most advice on customer engagement metrics is wrong.
It treats engagement like applause. More impressions, more clicks, more pageviews, more “activity”. Nice for dashboards. Useless for payroll.
If you run paid search, engagement only matters when it helps you answer one brutal question. Which signals predict revenue, and which ones are just noise?
The Reality of Customer Engagement Metrics
A lot of marketing teams still confuse attention with intent.
They celebrate impressions, CTR, likes, and a bit of traffic growth, then wonder why pipeline quality is rubbish. The gap is obvious once you look for it. Most content on customer engagement metrics still leans hard on awareness-stage numbers and gives almost no practical way to connect them to revenue outcomes, even though that gap is exactly where paid search budgets get wasted (MoEngage on deeper, more actionable engagement data).

That is why most engagement dashboards are vanity projects in disguise. They show motion, not progress.
A landing page can pull plenty of impressions and still send you low-quality leads. An ad can get clicked and still attract the wrong buyer. A busy funnel can be economically dead. If you do not connect the first click to downstream value, you are not measuring engagement. You are measuring digital foot traffic.
What I think is broken
Most frameworks assume a tidy journey from awareness to consideration to conversion.
Real buyers do not behave that way. Different segments engage differently across keywords, devices, and pages. Agencies see this every day across client accounts. One account calls a demo request success. Another needs qualified pipeline. Another only cares about booked revenue. Same ad platform. Completely different definition of value.
So stop asking whether users engaged.
Ask these instead:
- Did attention attract the right intent: If the click came from curiosity instead of buying intent, the engagement is cheap and mostly irrelevant.
- Did the page move the buyer forward: Not just scroll or linger, but interact with the parts that reflect genuine interest.
- Did that interaction correlate with quality and revenue: If not, cut it from your reporting.
If you want a good companion read on the business side of this, Performance Marketing Metrics does a solid job of framing performance through outcomes rather than vanity.
I wrote a similar argument in a more pointed way here: https://dynares.ai/resources/blog/stop-chasing-vanity-metrics-this-is-a-conversion
Track engagement like an operator, not a social media manager. A metric earns its place only if it helps you predict profitable conversion.
The only engagement metrics that matter for paid search
Paid search engagement is simpler than many reports make it look.
Use three layers. First, did the ad attract the right intent. Second, did the landing page move that intent forward. Third, did the traffic produce revenue. If a metric does not help you answer one of those questions, it belongs in a secondary dashboard.
Attention metrics
Attention metrics sit at the top of the model. They matter because they show whether your ad and keyword strategy are pulling in plausible buyers instead of random clicks.
CTR, ad relevance, search term alignment, and early exits all fit here. Use them to judge message match and intent fit. Do not use them to declare success. A high CTR often means you wrote a strong ad. It can also mean you promised too much and invited low-intent traffic onto the page.
This is why intent has to sit above raw engagement. Paid search is not social. You are not buying attention for its own sake. You are buying visits from people with a job to do, and some jobs are worth far more than others.
On-page behaviour metrics
The second layer is where weak reporting usually falls apart.
Track behaviour that shows active evaluation. Scroll depth is fine if it supports a stronger signal. Time on page is fine if it sits next to interactions that show buying interest. The useful events are clicks on pricing tabs, form starts, calculator use, comparison table clicks, FAQ expansion, trust-section engagement, and CTA clicks that stop short of submission.
These signals help you answer a harder question than "did the user stay?" They show whether the page helped the visitor qualify themselves.
That distinction matters. A landing page can hold attention and still fail commercially. If visitors read, scroll, and leave without touching the parts of the page that express intent, your offer is unclear, your traffic is wrong, or both.
A practical rule:
| Metric layer | What it answers | What to do with it |
|---|---|---|
| Attention | Did we attract the right click | Improve keyword selection and ad-message fit |
| On-page behaviour | Did the page trigger active evaluation | Improve clarity, reduce friction, sharpen the offer |
| Outcome | Did this traffic create revenue | Reallocate budget, bids, and creative around value |
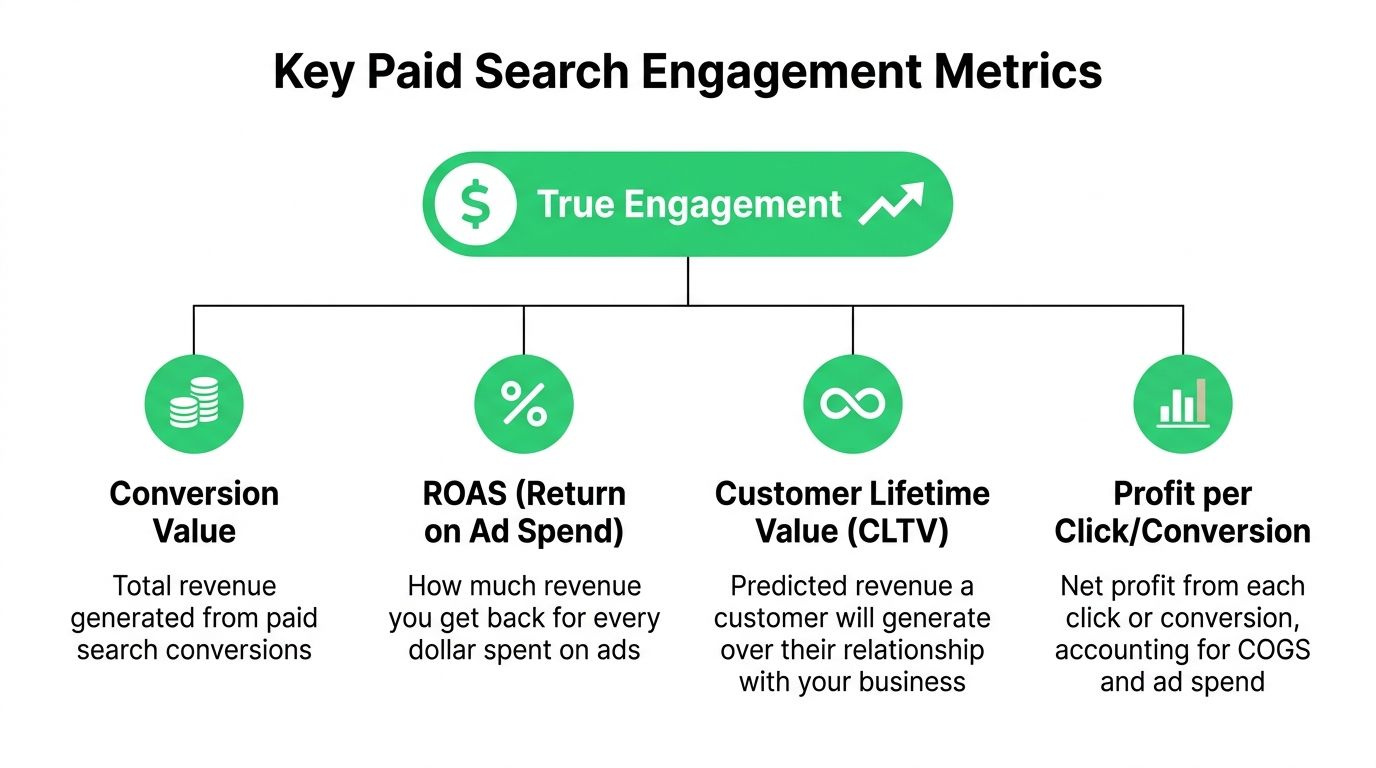
Outcome metrics
Revenue decides whether engagement was useful.
CLV, qualified pipeline, closed revenue, and payback period belong here. Pick the one that matches your business model, then force your paid search reporting to connect back to it. This is how you stop treating every lead as equal when they clearly are not.
If one keyword cluster drives fewer conversions but produces better customers, increase spend there. If another campaign floods the CRM with cheap form fills that sales never wanted, cut it. Volume without downstream value is noise.
Research on customer engagement metrics from Jimdo also points back to lifetime value as the metric that keeps engagement tied to commercial reality. Good. It should. Paid search teams that still optimise around lead counts alone are working with an incomplete model.
Fix the tracking before you fix the bids. If your setup cannot connect keyword, landing page behaviour, and sales outcome, use a proper Google Ads conversion tracking setup guide and sort that first.
CTR starts the process. On-page behaviour filters intent. Revenue decides what deserves more budget.
How to measure engagement across your funnel
Many teams do not have a metrics problem. They have an instrumentation problem.
They know what they want to understand, but their setup stops at the conversion event. That is too late. By then, you know who submitted the form. You do not know what behaviour predicted that conversion or which behaviours filtered out bad-fit traffic.

Start with observable events
Use Google Ads for the click-side signals. Use Google Tag Manager and analytics events for page-side signals. Use your CRM for sales-side reality.
That stack is enough for many teams.
Track events that reflect buyer movement, not just page activity. Good examples include scroll thresholds, clicks on pricing modules, form starts, form field progression, CTA clicks that do not submit, downloads, comparison table interactions, and trust-section engagement.
Do not track everything. Track the moments that represent value recognition.
Treat landing pages like products
The feature adoption idea becomes surprisingly useful here.
Feature adoption rate is calculated by dividing the number of users who tried a feature by the total user base and multiplying by 100. In product teams, low adoption often signals friction or poor communication of value. Research cited by InsiderOne notes an example of 10% weekly engagement with a new dashboard as a sign of targeting or UX friction, and reports that onboarding A/B testing increased adoption from 10% to 18% with a 25% rise in repeat logins (InsiderOne on customer engagement metrics).
Apply that thinking to your landing pages.
If visitors never interact with the pricing block, the comparison table, the testimonial strip, or the form itself, your page has an adoption problem. Not a traffic problem.
That is a much better diagnosis than saying users “didn’t engage”.
A practical setup I recommend
- Map the critical page elements: Define which blocks on the page should earn interaction if the visitor is a good fit.
- Fire events on those blocks: Use GTM to log scroll milestones, clicks, form starts, accordion opens, calculator use, and partial form completion.
- Push data downstream: Send those events into analytics and, where possible, into your CRM so sales outcomes can be compared against pre-conversion behaviour.
- Review by segment, not just page: Compare branded vs non-branded traffic, keyword groups, device categories, and audience cohorts.
The payoff is simple. You stop guessing why a page underperforms.
You can see whether the issue lives in the ad promise, the page structure, or the qualification process. And if you need a framework for tying this work back to actual business performance, this is a useful reference: https://dynares.ai/resources/blog/how-to-measure-marketing-roi
The missing framework for keyword intent
Many marketers measure every keyword with the same dashboard.
That is dumb.
An informational query and a transactional query do not deserve the same success criteria. Yet plenty of teams still judge both using the same set of customer engagement metrics. That flattens intent, hides weak pages, and rewards the wrong optimisations.
Match the metric to the search
The big blind spot in most customer engagement metrics advice is intent hierarchy. Current resources discuss engagement broadly, but they do not distinguish enough between informational, navigational, commercial, and transactional searches. That gap is especially painful in paid search, where a high-intent query should weight conversion rate and customer effort much more heavily than impressions or generic interaction (Sprout Social on customer engagement metrics).
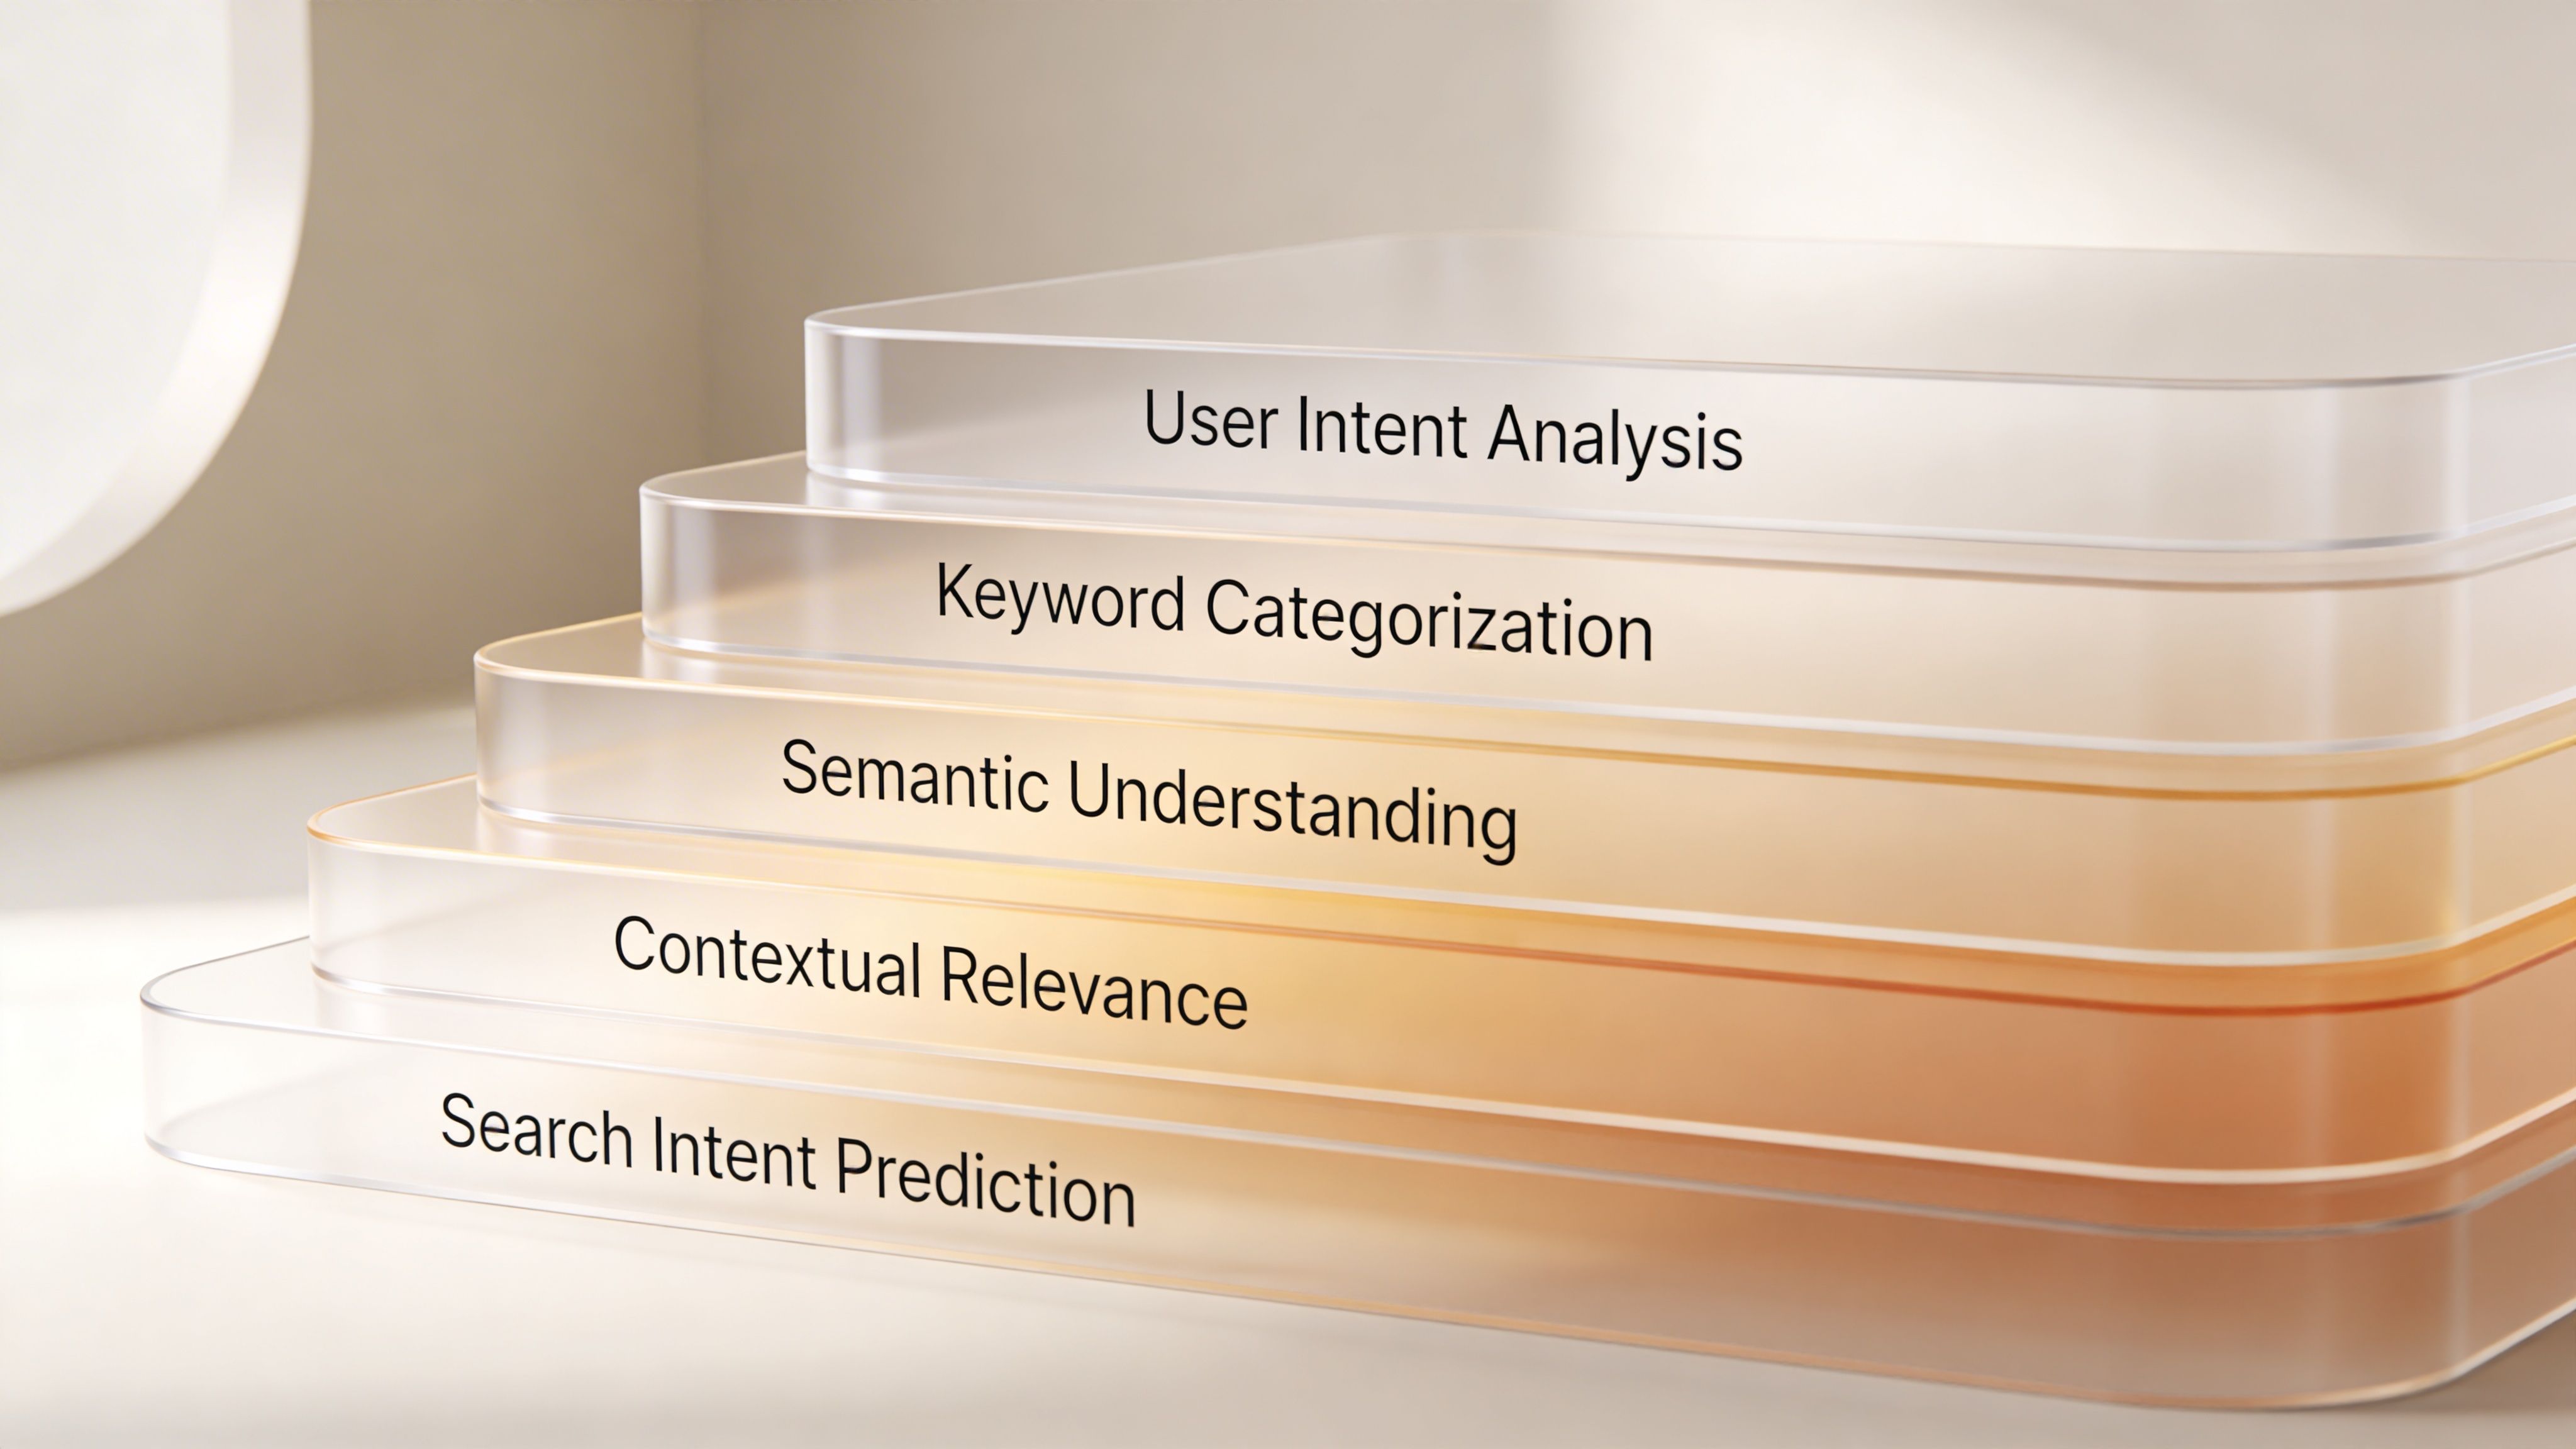
Here is the model I use:
- Informational keywords: Prioritise depth of consumption. Did the user read, scroll, and interact with explanatory content?
- Navigational keywords: Prioritise message confirmation. Did the page reassure the user they landed in the right place and move them to the next branded step?
- Commercial keywords: Prioritise evaluation behaviour. Compare clicks on pricing, comparison tables, proof points, and offer details.
- Transactional keywords: Prioritise conversion and friction reduction. Form completion, checkout ease, and abandon points matter most.
The metric should follow the intent. Not the other way around.
Pre-conversion effort matters more than people admit
A lot of teams measure satisfaction after purchase or after support interactions. Fine. But pre-conversion effort is where money leaks.
If a buyer searches a high-intent keyword and your form is annoying, your page is cluttered, or your CTA is vague, you have created friction at the most expensive point in the journey. That is not a copy problem. That is a measurement problem first.
Ask practical questions:
| Intent level | Primary engagement signal | Main risk |
|---|---|---|
| Informational | Content interaction | Irrelevant or shallow page |
| Commercial | Evaluation micro-conversions | Weak proof or unclear differentiation |
| Transactional | Conversion completion and effort | Friction during action |
If you want a broader primer on how search intent shapes page design, this is useful context: https://dynares.ai/resources/blog/what-is-search-intent-in-seo
This walkthrough is also worth a watch before you redo your keyword architecture.
If you optimise an informational keyword for direct conversion, you will underperform. If you optimise a transactional keyword for pageviews, you will waste money.
From metrics to money optimising for revenue
Revenue optimisation is less about finding a magic metric and more about fixing the exact break between intent and outcome.
Once your tracking is reliable, wasted spend stops looking mysterious. You can see which keyword clusters attract curiosity, which pages create evaluation, and which journeys produce cash. That is the whole point of engagement measurement. Tie behaviour to commercial value, or do not bother measuring it.
Read behaviour in revenue terms
A high click-through rate paired with weak page engagement points to a promise problem. The ad wins the click, then the page fails to continue the conversation. Fix the message match, tighten the opening section, and make the next action obvious.
Heavy interaction with calculators, pricing tabs, demos, or product details followed by poor conversion points to friction close to the money. Buyers are trying to qualify themselves. Your job is to remove effort, reduce doubt, and stop asking for unnecessary work.
Low engagement across the session usually comes from poor intent alignment at the keyword level. That is not a landing page tweak. It is an account structure problem.
The practical shift is simple. Stop treating every engagement signal as equally valuable. A scroll on an informational query and a completed quote form on a transactional query should never sit side by side in the same reporting logic.
Use AI where it helps
AI is useful for production and pattern recognition. That is it.
Teams already know where many of the problems are. They do not have the capacity to build ten intent-specific page variants, rewrite ad copy for every cluster, or test shorter forms across dozens of campaigns in a sensible timeframe. AI helps when it reduces that production bottleneck and speeds up response time.
Adobe notes that organisations are using AI to personalise web experiences, predict customer needs, and improve consistency across touchpoints, all of which matter if you want engagement signals to turn into revenue instead of noise (Adobe Digital Trends report).
Use automation with rules. If a system generates more assets but your intent model is sloppy, you just scale confusion faster.
One practical option is dynares, which generates keyword-matched ads, landing pages, and forms, runs Auto A/B Testing, and pushes conversion values back into Google Ads. Useful for teams trying to scale intent-specific experiences across large paid search accounts. Useless if the underlying strategy is still vague.
A decision rule that keeps budgets honest
Review each landing page and keyword cluster with one question in mind. Does this behaviour lead to revenue, or just activity?
Use four buckets:
- Scale: Strong intent match, strong lead or sales quality, clear revenue contribution.
- Fix the page: Good click volume, weak engagement, poor continuation from ad to page.
- Remove friction: Good evaluation behaviour, weak completion rate, obvious effort near the action.
- Cut it: Plenty of activity, little value, no commercial case for more spend.
This framework is more useful than another dashboard full of blended engagement rates. It gives you a way to act. Keep what creates revenue. Repair what blocks it. Kill what flatters the report and drains the budget.
Real examples from the trenches
The best test of any framework is whether it survives contact with a real account.
Not a conference slide. Not a tidy attribution model. A messy account with impatient stakeholders and a budget that gets reviewed every week.
Example one
A B2B SaaS campaign had healthy CTR and decent lead volume, but sales hated the leads.
The problem was not the ads. The landing page opened with broad benefit language that appealed to casual researchers, not active buyers. Scroll tracking and interaction events showed people were landing, skimming the hero, and leaving before engaging with pricing or qualification content.
We changed the page structure. Clearer audience fit. Stronger disqualification language. More obvious product specifics above the fold.
Lead volume softened. Lead quality improved. That is a trade I will take every day.
Example two
An e-commerce account kept blaming traffic quality for poor performance on high-intent queries.
Traffic was fine. The issue was friction. Users clicked product pages, interacted with delivery and returns information, then dropped during the final action stage. The page was asking for too much effort at the exact moment the user wanted momentum.
We simplified the path, reduced clutter, tightened trust messaging, and made the key action easier to complete on mobile.
The lesson was boring but valuable. When buying intent is high, effort kills conversion faster than mediocre copy.
Example three
An agency account looked great in platform reporting. Busy campaigns, plenty of clicks, respectable conversion totals.
Then the CRM view told a different story. The keyword groups producing the most leads were not producing the most value. A smaller set of commercial-intent terms produced fewer conversions but better-fit opportunities and stronger downstream economics.
So we changed reporting first. That was the key unlock.
Once the team stopped worshipping lead volume, budget allocation got sharper. Creative got sharper too. People stopped optimising for noise.
Most accounts do not need more metrics. They need fewer metrics, tied more tightly to buyer intent and commercial outcomes.
If any of this sounds familiar, have a look at dynares. It is built for PPC teams that need to produce keyword-matched ads and landing pages at scale, with tracking and conversion value data tied back into Google Ads. Useful when the strategy is clear and execution speed is the constraint.
x4
$0.18
$0.23
dynares let us go from generic pages to keyword-specific experiences without hiring developers or rebuilding our stack. Our search traffic converts at over 79% now, CPC is down, and we can test new ideas in minutes instead of weeks.


x8
-68%
+581%
dynares helped us turn paid traffic into a much more efficient lead generation engine. In just four months, we significantly increased lead volume while bringing down cost per conversion.


Create reusable, modular page layouts that adapt to each keyword. Consistent, branded, scalable.
From ad strategy breakdowns to AI-first marketing playbooks—our blog gives you the frameworks, tactics, and ideas you need to win more with less spend.
Discover Blogour platform to drive data-backed decisions.