Let's be direct. Most marketers are drowning in data but absolutely starved for wisdom. We obsess over tracking dozens of lead generation KPIs, but only a handful actually move the needle.
The rest is just noise, and it's expensive noise at that.
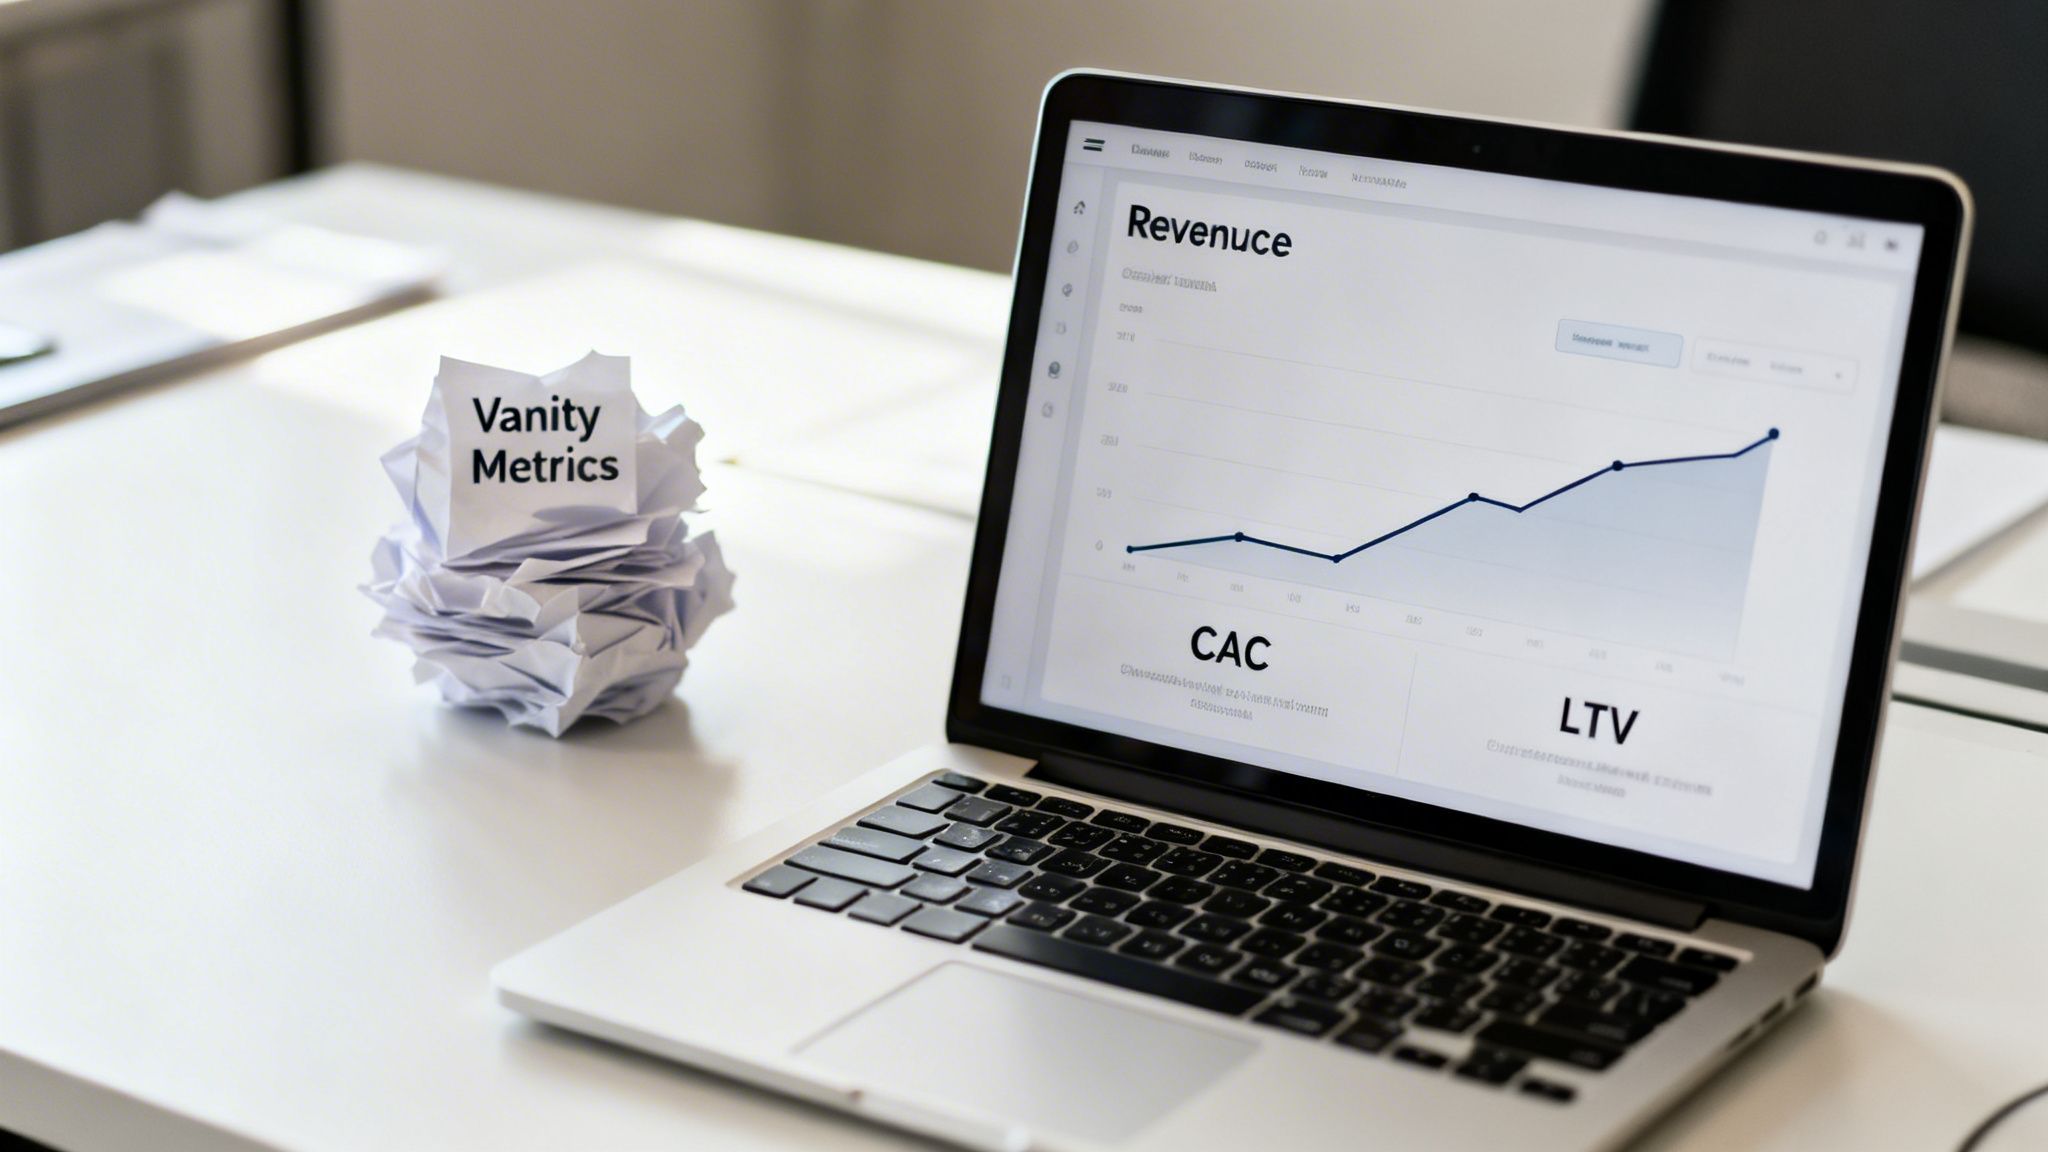
Stop chasing vanity metrics
This guide is for ambitious entrepreneurs, lean growth teams, and agency managers who know their most valuable asset is time. We’re going to cut through the fluff and focus on the KPIs that connect directly to revenue.
Forget the complex dashboards that look impressive but tell you nothing.
We’ll talk about the core metrics—the ones that signal whether your marketing is a profit center or a cost center. It's about building a practical, no-nonsense measurement framework that scales as your business grows.
The goal? To turn your paid marketing from a gamble into a predictable engine for growth.
I'll share how I think about measuring success, moving beyond simple lead counts to understanding lead quality and value. This isn't just theory. It's about being accountable for every euro spent and proving real impact.
What really matters
Let's get one thing straight: activity is not achievement. Clicks, impressions, even a high volume of leads mean absolutely nothing if they don't convert into paying customers. The only metrics worth obsessing over are those that show a clear line to business growth.
This means focusing on things like the actual cost to acquire a paying customer, not just a lead. Or the lifetime value of the customers you bring in. And the return you get on your ad spend.
Anything else is a distraction. A high number of leads might feel good, but if your sales team is complaining about quality, you're failing. A low cost-per-lead is irrelevant if none of those leads ever close.
And a high conversion rate is great, but before celebrating, you should check out our guide on what is conversion in marketing to be sure you're tracking the right actions.
The big shift is from how many leads did we get? to how much revenue did our marketing generate? Once you make that mental switch, your entire approach to lead generation KPIs will change for the better.
The foundational KPIs you cannot ignore
Alright, let's cut to the chase. If you're going to track anything—and I mean anything—it has to be these foundational lead generation KPIs. Getting these wrong is like trying to build a skyscraper on quicksand. It's not just a bad idea; it's a guaranteed way to burn cash and waste everyone's time.
We're talking about the non-negotiables: Lead Volume, Conversion Rate, and Cost Per Lead (CPL). But don't just nod along like you've heard this before. Most people track these metrics poorly, looking at them in isolation and drawing all the wrong conclusions.
A high lead volume with a garbage conversion rate is just a busy-work generator. A super-low CPL for leads who will never buy is even worse. This is your ground truth. Getting this right is the foundation for making smart decisions with your budget and your team's precious time.
Lead volume is more than just a number
First up, Lead Volume. This is the most basic metric, simply counting how many potential customers you’ve attracted. But looking at the total number is a rookie move. The real insight comes from segmenting this data. You need to know where these leads are coming from.
Is your content marketing pulling in a slow, steady stream of high-quality prospects? Are your Google Ads campaigns generating a flood of leads? You need to break it down. In B2B, organizations generate an average of 1,877 leads per month, but the magic is in the details.
Knowing that inbound channels like SEO can deliver leads that are 35% more likely to be high-scoring is critical. It's no wonder that 50% of marketers now see lead generation as their top priority. Without segmentation, you’re flying blind. You might be celebrating a huge number of leads from one channel while completely missing that another, smaller channel is delivering all the leads that actually turn into revenue.
Conversion rate tells the real story
Next is Conversion Rate, the percentage of visitors who take a desired action. This is where the story gets interesting. A high lead volume means nothing if your conversion rate is in the gutter. It’s like hosting a massive party but nobody is having any fun. 🤷♂️
Think about the entire journey, not just one step.
- Ad Click-to-Lead Conversion Rate: Of all the people who clicked your ad, how many actually filled out the form on your HubSpot landing page? This tells you if your page is doing its job.
- Lead-to-Qualified-Lead Rate: How many of the leads you generated are actually a good fit for your business? This is a crucial filter for quality.
- Qualified-Lead-to-Customer Rate: This is the money metric. How many of those qualified leads did your sales team actually close?
A low conversion rate at any of these stages is a red flag signaling a major bottleneck. Maybe your ad promises one thing and your landing page delivers another. Perhaps your form, tracked with Google Tag Manager, is too long and complicated. Or maybe the leads you're generating just aren't the right people. Tracking conversion rate at each step turns your funnel from a black box into a clear, diagnostic tool.
Cost per lead dictates your budget's health
Finally, we have Cost Per Lead (CPL). This KPI is brutally honest—it tells you exactly how much you're paying to get one person to raise their hand. The formula is simple: Total Marketing Spend / Total New Leads.
But a 'good' CPL is completely relative. A €200 CPL might be a steal if your product costs €20,000, but it's a catastrophe if you're selling a €50 subscription. The key isn't to chase some arbitrary industry benchmark; it's to understand your break-even point and your own business economics. What can you afford to pay for a lead and still be wildly profitable?
Your CPL, combined with your conversion rate, determines the health of your customer acquisition engine. If you can acquire leads at a sustainable cost and convert them into customers profitably, you have a scalable business. If you can't, you have a hobby.
These three foundational lead generation KPIs work together. They are the essential dials you need to monitor and tune. Neglect one, and the whole system becomes unreliable. Master them, and you're on the path to building a predictable growth machine. To get a broader perspective, you might be interested in our guide on other essential marketing KPI examples.
Trying to make sense of your lead generation KPIs in a vacuum is one of the fastest ways to get confused and burn cash. It’s a classic mistake. A real builder understands that different metrics tell you different things at each stage of the customer's journey.
It’s just like building a product. You don’t obsess only over the final sale; you scrutinize the user onboarding, that first interaction, and the real reasons people stick around. Your marketing funnel is no different. You have to map your KPIs to the Top of the Funnel (ToFU), Middle of the Funnel (MoFU), and Bottom of the Funnel (BoFU).
This simple shift turns your reporting from a boring, static list of numbers into a living story about how prospects actually move through your pipeline. It’s a diagnostic tool. Are you failing to get in front of the right people? Are your landing pages failing to convert the traffic you paid for? Or is sales dropping perfectly good leads?
Top of funnel: attention and awareness
This is your first impression. The top of the funnel is all about casting a wide, but intelligent, net. You’re trying to capture the attention of your ideal audience without lighting your budget on fire. You aren't closing deals here; you're just starting a conversation.
The only question that matters at this stage is: Are we reaching the right people, and do they care enough to click?
Your obsession should be on two core KPIs: Click-Through Rate (CTR) and Cost Per Click (CPC). A low CTR is a massive red flag. It tells you your creative, copy, or targeting is off. Your message isn't connecting, and you're paying for impressions nobody cares about. CPC is what you pay for that initial flicker of interest. The goal isn’t just to get the lowest CPC possible, but the lowest CPC for a quality audience. A low CPC paired with a high CTR is the sweet spot—it means you've found an efficient way to grab attention.
Think of your ToFU metrics as the bouncer at a club. Their job isn't to guess who will run up the biggest tab. It's just to check IDs and see who's even interested in coming inside. If you get this part wrong, the club stays empty.
Middle of funnel: interest and evaluation
Okay, they clicked. They’re in the door. Now what? This is where you start to separate the window shoppers from the real buyers. They’ve hit your landing page, and you have just a few seconds to prove you have something valuable. The game shifts from grabbing attention to holding it.
Here, your focus moves to KPIs that measure intent: Landing Page Conversion Rate and Cost Per Acquisition (CPA) / Cost Per Lead (CPL). The conversion rate is the big one. Of all the people who landed on your page, how many actually did the thing you wanted? A low conversion rate often points to a serious disconnect between your ad's promise and the landing page's reality. Learning to spot and fix these broken funnels is a non-negotiable skill for anyone focused on growth.
CPA/CPL is where your ad spend meets a real business outcome. How much did it cost, in total, to get that single lead? This metric ties your top-of-funnel spending directly to a tangible result. This is where you truly earn your keep as a marketer.
The diagram below shows how these foundational metrics—volume, rate, and cost—work together to give you a complete picture of your lead generation engine.
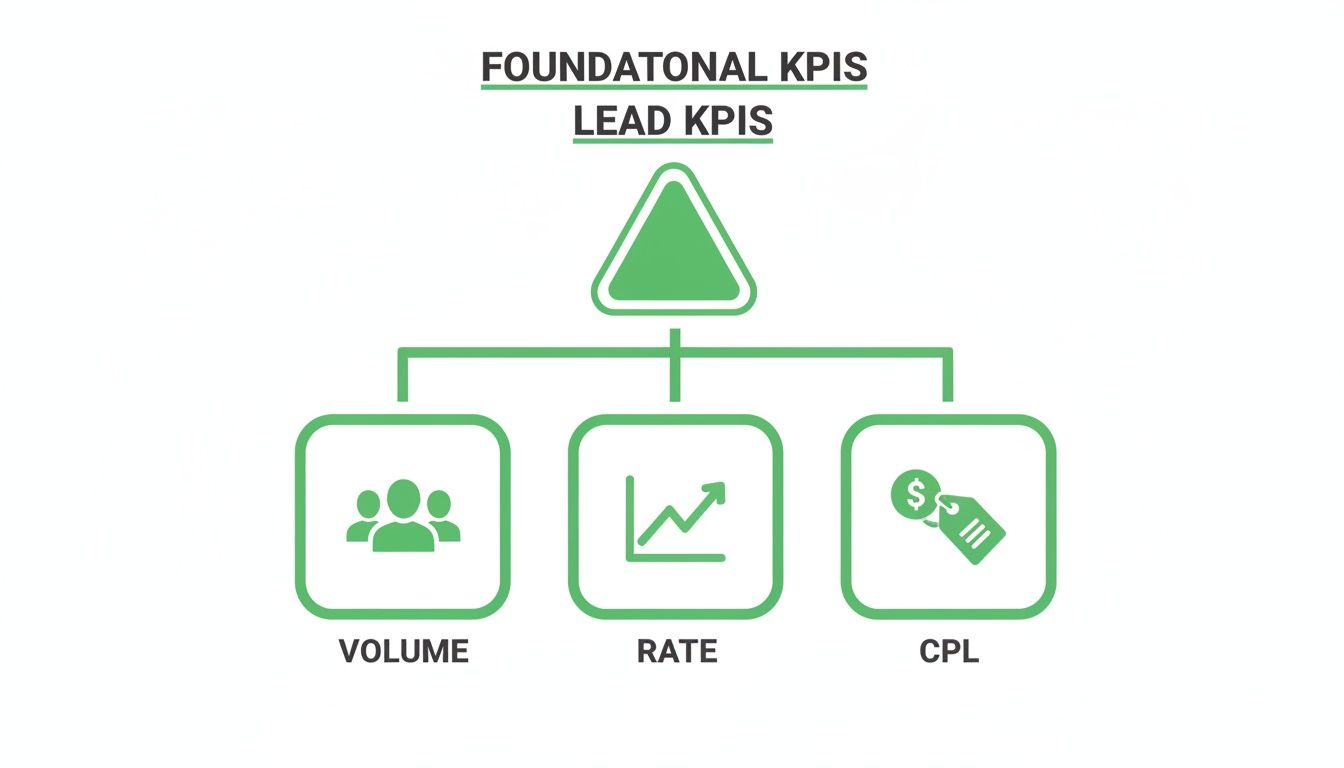
As you can see, you can't just look at how many leads you got. You have to know how efficiently you got them (Rate) and at what cost (CPL).
Bottom of funnel: the money metrics
This is it. The final act. This is the only stage that truly matters to the bottom line. All the clicks, conversions, and clever ad copy mean absolutely nothing if these leads don't become paying customers. This is where marketing and sales must be perfectly synced, chasing the same goal: revenue.
These are the KPIs you report to your board and your investors: Lead-to-Customer Rate, Customer Lifetime Value (CLV), and Return on Ad Spend (ROAS). The lead-to-customer rate is the ultimate gut-check on lead quality. If this number is low, you’re either generating junk leads or the sales process is broken. CLV puts your acquisition costs into their proper context. And ROAS? For every single euro you put into ads, how many euros of revenue did you get back? This is the clearest, most honest measure of your campaign's profitability.
Funnel stage KPI map
To make this crystal clear, here’s a simple table that maps the most important KPIs to each funnel stage. This helps you focus on what to measure and when, so you're not just staring at a wall of data.
Funnel StagePrimary KPIsWhat It Tells YouTop of Funnel (ToFU)CTR, CPC, Impressions"Are we reaching the right people effectively?"Middle of Funnel (MoFU)Conversion Rate, CPL/CPA"Are we converting interest into actual leads?"Bottom of Funnel (BoFU)Lead-to-Customer Rate, ROAS, CLV"Are these leads turning into profitable revenue?"
Looking at your KPIs through this funnel-based lens stops you from chasing vanity metrics. It forces you to think like a business owner, connecting every euro spent to a real outcome. This isn't just a better way to report; it's a better way to build a company.
Building a tech stack for bulletproof tracking
Let’s be brutally honest. Talking about lead generation KPIs is a waste of time if your data is a mess. You can't optimize what you can't measure, and if your tracking is a leaky bucket, you’re just guessing with your budget.
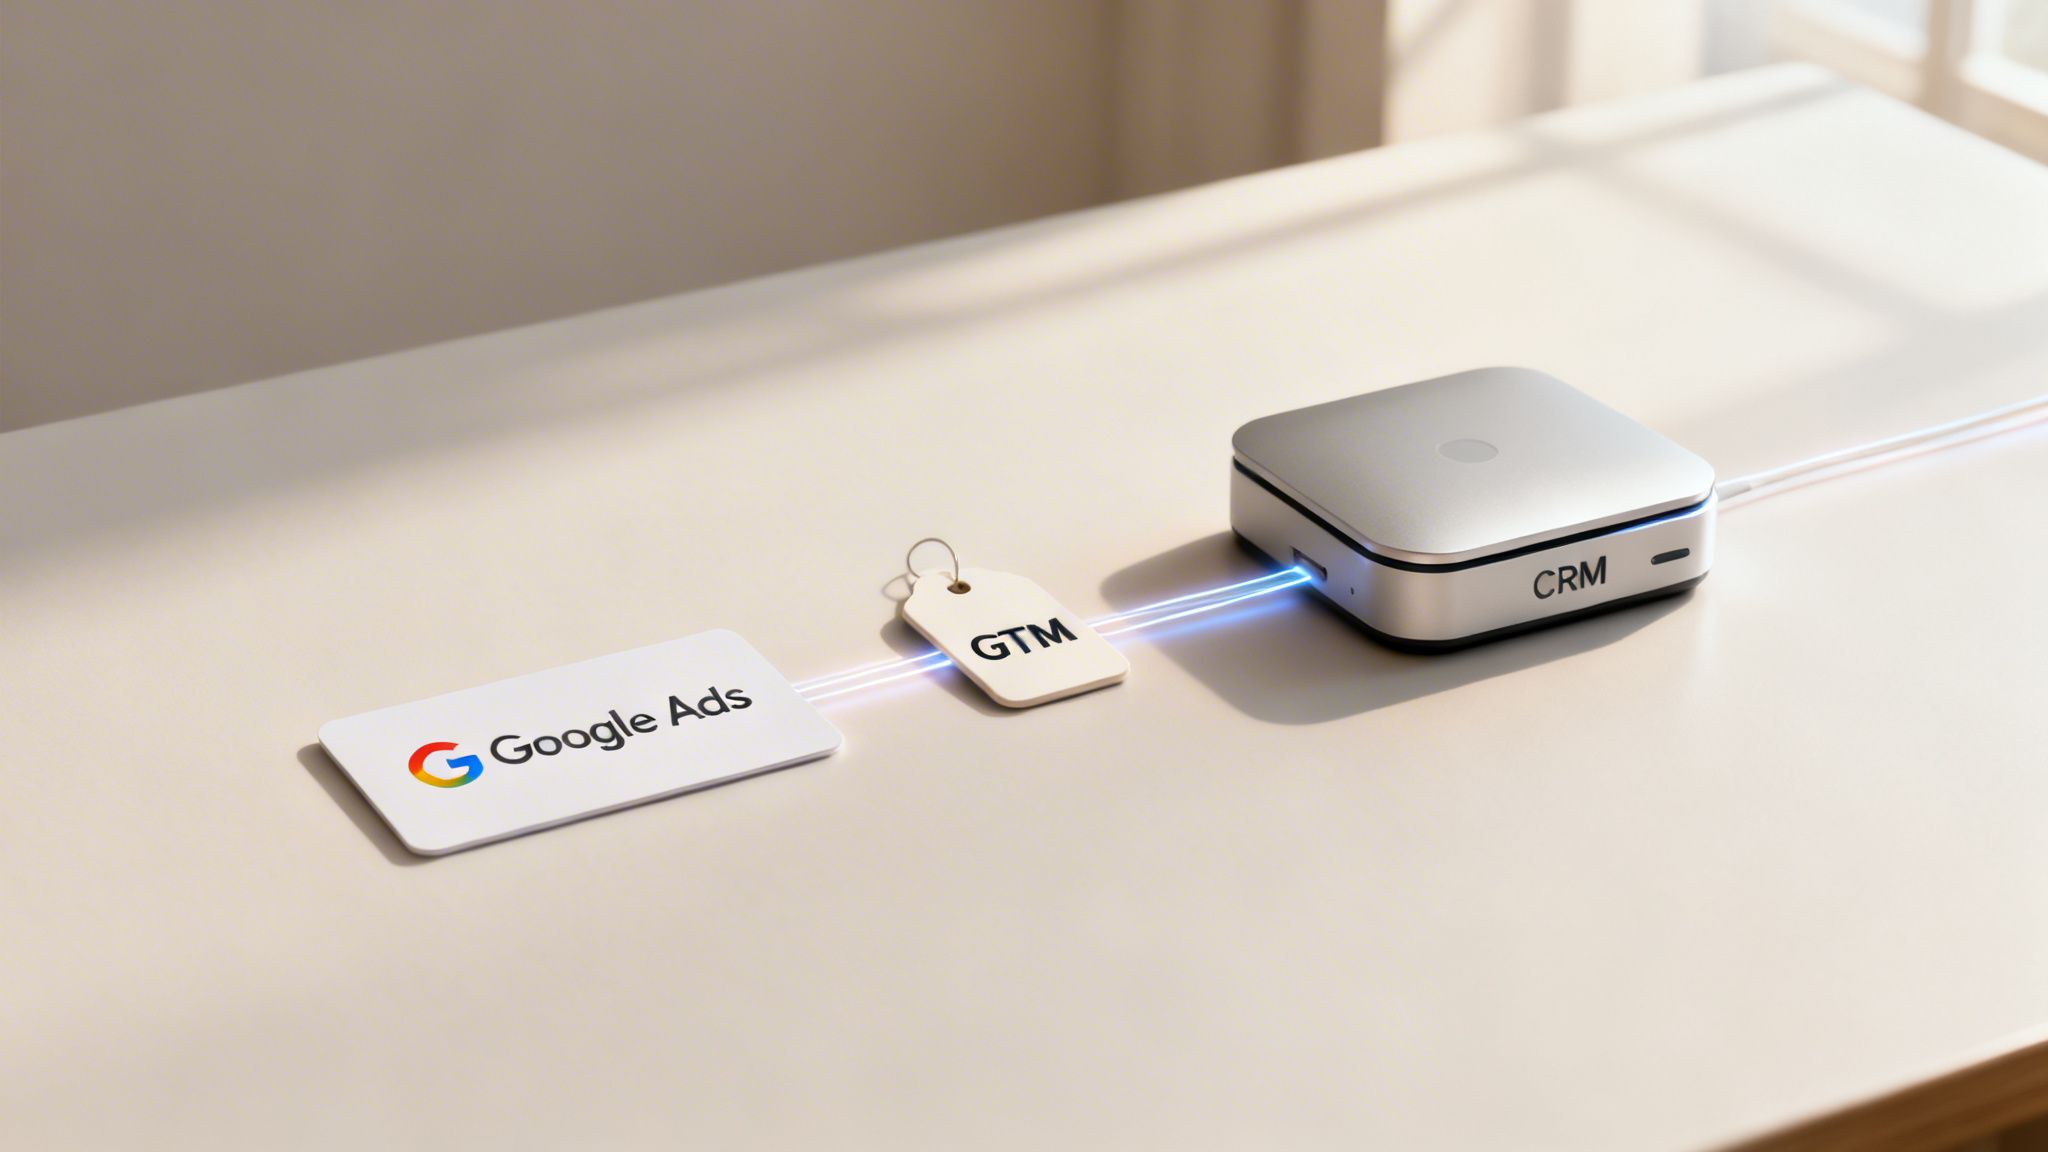
This is where we get practical. Forget the high-level theory for a minute. I'm going to walk you through how to actually wire up your lead tracking using the tools we all live in: Google Ads, Google Tag Manager (GTM), and a CRM like HubSpot.
The goal is to build a closed-loop system where you can trace a paying customer all the way back to the exact keyword and ad that brought them in. This is the technical backbone of revenue-driven marketing. It’s how you graduate from counting leads to counting money.
Google Ads is not just for clicks
First, let's fix a common—and frankly, lazy—mistake people make in Google Ads. They set up one generic conversion action, like "form submission," and call it a day. That’s dumb. It tells you absolutely nothing about lead quality. A "contact us" lead is not the same as a high-intent "request a demo" lead.
You need to create distinct conversion actions that signal intent.
- Top-of-Funnel Conversion: An ebook download. Assign it a low value, maybe €1, just to tell Google it’s a starting point.
- Mid-Funnel Conversion: A "contact us" form fill. These are more valuable, so you might give them a value of €25 or €50.
- Bottom-of-Funnel Conversion: A "book a demo" request. This is gold. These are your hottest leads and should have the highest value, maybe €100 or more.
By doing this, you're giving Google’s Smart Bidding the signals it needs to find more people like your best leads, not just more people who like filling out forms.
Google Tag Manager is your best friend
So how do you actually get this granular tracking onto your site without constantly bothering your developers? The answer is Google Tag Manager. If you're not using it, you need to start. It’s a game-changer.
GTM acts as the middleman between your website and all your marketing tools. Instead of hard-coding dozens of tracking scripts, you place one GTM snippet on your site. Then, you can deploy, test, and manage all your tags—Google Ads, Analytics, Facebook Pixel, you name it—from the GTM interface.
This is about agility. A new campaign needs a new conversion tag? You can have it live in 10 minutes from GTM without writing a single line of code or waiting in a developer’s backlog. It empowers marketers to own their measurement stack.
If you’re new to this, it’s worth taking the time to learn how to use Google Tag Manager properly. It’s a core skill for any modern marketer.
The CRM closes the loop
Here’s the final piece of the puzzle: connecting your marketing data to your sales data. This is where your CRM comes in. When a lead comes from a Google Ad, you need to capture the source data—campaign, ad group, keyword—and pass it into that lead's record in your CRM.
This is what "closed-loop reporting" actually means. When a deal is marked "Closed-Won" in HubSpot six months later, you can trace that revenue directly back to the specific keyword that started it all. Now you're not just calculating Cost Per Lead; you’re calculating Return on Ad Spend (ROAS) with dead accuracy.
Platforms like our own at dynares automate a lot of this heavy lifting. We automatically inject all the necessary tracking and can even upload conversion values back to Google Ads once a lead progresses in your CRM. This is what enables true revenue optimization, not just lead volume optimization.
It’s the smarter way to build a predictable growth engine. 🚀
From data to decisions: a practical optimization workflow
Let’s be blunt: data is useless without action. Staring at dashboards and charts all day won't move the needle. This is where we stop admiring our metrics and start turning those lead generation KPIs into a repeatable optimization machine.
I’m going to share a simple workflow for looking at your numbers, making smart changes, and getting better results, month after month. It's not about finding a magic bullet; it's about building a process. This is how you stop gambling with ad spend and start engineering your growth.
Establish your baseline and set sane targets
First, you can't improve what you don't measure. Before you touch a single campaign, you need to know where you stand. Let your ads run for a bit—a week, a month, whatever gives you enough data to be meaningful—and record your foundational KPIs like Cost Per Lead (CPL), Landing Page Conversion Rate, and Lead-to-Customer Rate.
This is your baseline. It's the "you are here" pin on the map. Only once you have this can you set targets that aren't just wishful thinking.
If your landing page converts at 1%, aiming for 15% next month is a recipe for failure. A realistic goal is to shoot for 1.5% or 2%. Small, steady gains are what win the game.
A/B test what actually matters
Now, let's talk about A/B testing. Most marketers get this horribly wrong. They burn weeks testing button colors and tiny headline tweaks. Honestly, that's a waste of time unless you have massive traffic. It’s fiddling while Rome burns.
You need to test the big, strategic stuff that can actually create a step-change in performance. Test your core value proposition. Test your offer. Is a free trial more compelling than a live demo? Test the carrot you're dangling. Test radically different ad copy that speaks to different pain points. You might stumble upon an entirely new angle that resonates with your market.
And of course, knowing how to create forms on WordPress is a core skill for capturing that lead data in the first place. That form is where the click turns into a lead, so make sure it's solid.
Embrace an 'always-on' optimization mindset
This is the real key. The best performance marketing isn't a series of start-stop campaigns. It’s a continuous, 'always-on' machine that is constantly learning and improving. This is where modern tech becomes a superpower. 🚀
Imagine an AI-driven platform that does this for you. You feed it your keywords, and it automatically generates thousands of keyword-specific ad variants and matching landing pages. It runs tests 24/7, learning what messaging works for high-intent searches, and automatically shifts budget to the winners in real-time. This isn’t science fiction; it’s how modern performance marketing works with tools like our platform at dynares.
This approach systematically improves your Conversion Rate and Return on Ad Spend (ROAS) month over month. It's how you move from guessing to knowing, from hoping to predicting.
Ultimately, Conversion Rate is the king of lead gen KPIs because it directly ties your ad spend to a real business outcome. While the B2B industry average limps along at around 2.9%, top performers hit 10-15%. That's a massive gap.
Data shows that most businesses focus their dashboards on about seven core metrics, with conversion rate at the center of any optimization effort. With the average cost per lead sitting at a painful $198.44, every single percentage point of conversion matters. This is why dynamically creating high-intent pages for each keyword is so crucial; it directly attacks the most important metric. You can dig into more of these numbers from our friends over at Databox.
Alright, let's wrap this up with the one idea that separates the pros from the people just playing with budgets: not all leads are created equal.
Don't just count leads, make leads count

The future of lead generation isn't about getting more leads. It's about getting valuable ones. As operators, we’re in the business of generating revenue, not just a list of email addresses from form submissions.
Too many marketers get hooked on the dopamine hit of a high lead count. It feels like progress, but it’s usually just a vanity metric. If you’re not tracking the right lead generation KPIs, you might be celebrating a record month while your sales team is quietly losing their minds over a pile of junk.
This is the part where we stop thinking of marketing as a cost center and start building a predictable revenue machine. It’s about making the leap from metrics that track activity to KPIs that measure real business impact.
Moving beyond cost per lead
The obsession with Cost Per Lead (CPL) is a classic trap. It pushes you to optimize for the cheapest possible lead, which almost always means you’re sacrificing quality. A low CPL looks great on a spreadsheet, but it's a terrible goal if those leads never convert or have a tiny deal size.
We need to shift our focus to the metrics that actually signal business health, like Customer Acquisition Cost (CAC), Return on Ad Spend (ROAS), and Customer Lifetime Value (CLV). These are the KPIs of a true business owner. They’re about profit and sustainability, not just filling the top of the funnel with activity. If you need a refresher on the basics, our guide on how to create leads is a solid place to start.
The power of lead scoring and sales alignment
Making this shift depends on one non-negotiable ingredient: an almost psychic connection with your sales team. You have to work together to define what a "good" lead actually looks like. This is where lead scoring comes in.
It’s a simple system where you assign points to leads based on who they are and what they do. A CEO from a target company who requests a demo? That’s a high-score lead. Someone with a Gmail address who downloaded a top-funnel ebook? A much lower score.
This process forces you to nail down the characteristics of your best customers and then reverse-engineer your marketing to find more people just like them. It’s no longer about getting any lead; it's about getting the right lead.
This is the paradigm shift we've been building towards. You stop telling Google to get you cheap leads, and you start telling it to get you customers who look like your most profitable ones. You’re moving from volume to value.
Building a revenue machine for 2026
This is where advanced tools finally get to prove their worth. By connecting your CRM directly to your ad platforms, you can feed real business outcomes back into the system. This is exactly what uploading offline conversion values to Google Ads is for.
When you tell Google not just that you got a lead, but that the lead turned into a €50,000 deal, you give its AI the fuel it needs to work magic. It stops optimizing for cheap clicks or form fills and starts hunting for high-value customers. 🚀
This is the visionary part. This is where you see your marketing not as a department with a budget, but as a scalable, predictable engine for driving revenue. It isn't a fantasy; it's how we build sustainable, high-growth companies. This is how we win in 2026.
Frequently asked questions about lead generation KPIs
Every time I talk to other founders and marketers, the same few questions about lead gen KPIs pop up. Let's get straight to them. No fluff, just practical answers you can actually use to make better calls.
What is a good CPL?
This is always the first question, and my answer is always the same: it depends. Anyone who gives you a universal "good" Cost Per Lead is selling you something.
A good CPL is completely relative to your own business.
A €200 CPL might feel steep, but it's an absolute bargain if those leads consistently become €10,000 customers. On the flip side, that same €200 CPL is a total disaster if the customer is only worth €100. The only thing that truly matters is how your CPL stacks up against your Customer Lifetime Value (CLV).
Forget about chasing meaningless industry benchmarks. The only benchmark that matters is whether or not you're profitable. Get a deep understanding of your unit economics—what a customer is worth and what you can afford to pay for one. That's your number.
How often should I review my lead gen KPIs?
Your review schedule should match how fast a metric moves and how strategic it is. It's a waste of time to review everything with the same frequency. This is how I break it down:
- Daily or Every Other Day: A quick glance at top-line numbers, like total ad spend and lead volume. You're just looking for fires.
- Weekly: A deeper dive into funnel metrics like conversion rates, CPL by campaign, and CTR. This is where you find real optimization opportunities.
- Monthly or Quarterly: The big picture. Review strategic KPIs like Customer Acquisition Cost (CAC) and Return on Ad Spend (ROAS).
Which KPI is the most important?
If you force me to pick just one, it’s the relationship between Customer Lifetime Value (LTV) and Customer Acquisition Cost (CAC). Full stop.
Every other KPI is just a lever you can pull to make that fundamental ratio better.
Think about it: your CTR and CPC dictate the initial cost of getting a click. Your Conversion Rate determines how many of those clicks turn into leads. Your CPL measures the cost of acquiring each one of those leads.
But all of those are just inputs. The ultimate output, the true sign of a healthy and scalable business, is a profitable LTV:CAC ratio. If you can consistently acquire customers for less than they're worth to your business, you have a formula for growth. That’s the entire game.
At dynares, we built our entire platform around this principle. We automate the creation of high-intent ads and landing pages to lower your CAC, while our conversion value reporting helps you optimize for LTV. It's designed to turn your ad spend into a predictable revenue engine. See for yourself how it works at https://dynares.ai.


